Split the data by subset
Last compiled on 17 November, 2022
We considered five major cell subsets: (1) myeloid, (2) T, (3) B and plasma, (4) stromal, and (5) epithelial cells. We classified cells into these subsets according to their gene expression.
Load libraries
library(Seurat)
library(plyr)
library(dplyr)
library(ggplot2)
library(DropletUtils)
library(celda)
library(SingleCellExperiment)
library(scater)
library(scran)
library(scDblFinder)
library(viridis)
library(MASS)
library(patchwork)
library(readr)
Load extra sources
get_density <- function(x, y, ...) { # function from https://slowkow.com/notes/ggplot2-color-by-density/
  dens <- MASS::kde2d(x, y, ...)
  ix <- findInterval(x, dens$x)
  iy <- findInterval(y, dens$y)
  ii <- cbind(ix, iy)
  return(dens$z[ii])
}

fancy_scientific <- function(l) { # function from https://stackoverflow.com/a/24241954
     # turn in to character string in scientific notation
     l <- format(l, scientific = TRUE)
     # quote the part before the exponent to keep all the digits
     l <- gsub("^(.*)e", "'\\1'e", l)
     # turn the 'e+' into plotmath format
     l <- gsub("e", "%*%10^", l)
     # return this as an expression
     parse(text=l)
}

setwd("~/000_GitHub/ibd-bcn_single_cell")
source('source/functions_scrnaseq.R')
source('source/colors.R')
Load the data
setwd('~/000_GitHub/ibd-bcn_single_cell/Analysis of our data/02_Samples_Together/')
seudataf <- readRDS(file = 'filtered_data_together.RDS')
Dimension reduction
We cluster the samples using louvain classification and look for the markers.
setwd('~/000_GitHub/ibd-bcn_single_cell/Analysis of our data/02_Samples_Together/')
seudataf <- seurat_to_pca(seudataf)

a <- ElbowPlot(seudataf, ndims = 50) +
  geom_vline(xintercept = 23, colour="#BB0000", linetype = 2)+
  labs(title = paste0('Elbowplot'))+ theme_classic()

seudataf <- FindNeighbors(seudataf, dims = 1:23)
seudataf <- RunUMAP(seudataf, dims = 1:23)

b <- DimPlot(seudataf, group.by = 'sample_name', pt.size = 0.1) +
  labs(title = '23 PCS') +
  theme_classic() +
  theme(legend.position = 'bottom')

(a+b) / guide_area() +
  plot_layout(heights = c(0.7,0.3),guides = 'collect')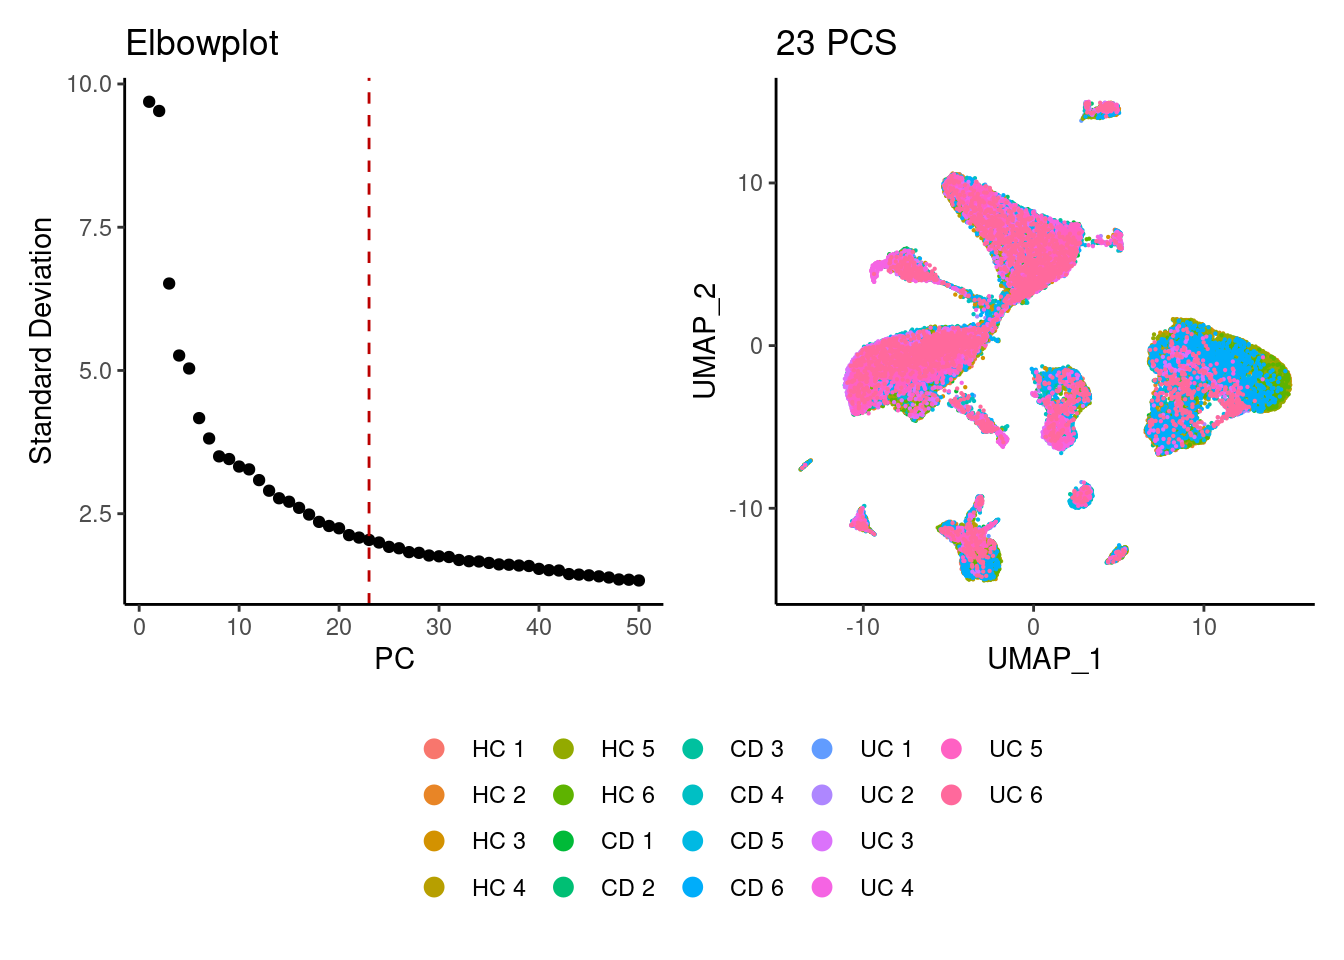
dir.create('ALL')
dir.create('ALL/filter_65')
seudataf <- resolutions(seudataf, resolutions = c(0.1, 0.3, 0.5),
                         workingdir = 'ALL/filter_65/',
                         title = 'ALL')
saveRDS(seudataf,'ALL/filter_65/ALL.RDS')
Resolutions plot
a <- DimPlot(seudataf, group.by = 'RNA_snn_res.0.1', label = T)  + theme_classic() + NoLegend()
b <- DimPlot(seudataf, group.by = 'RNA_snn_res.0.3', label = T)  + theme_classic() + NoLegend()
c <- DimPlot(seudataf, group.by = 'RNA_snn_res.0.5', label = T)  + theme_classic() + NoLegend()

(a + b) / (c +  plot_spacer() )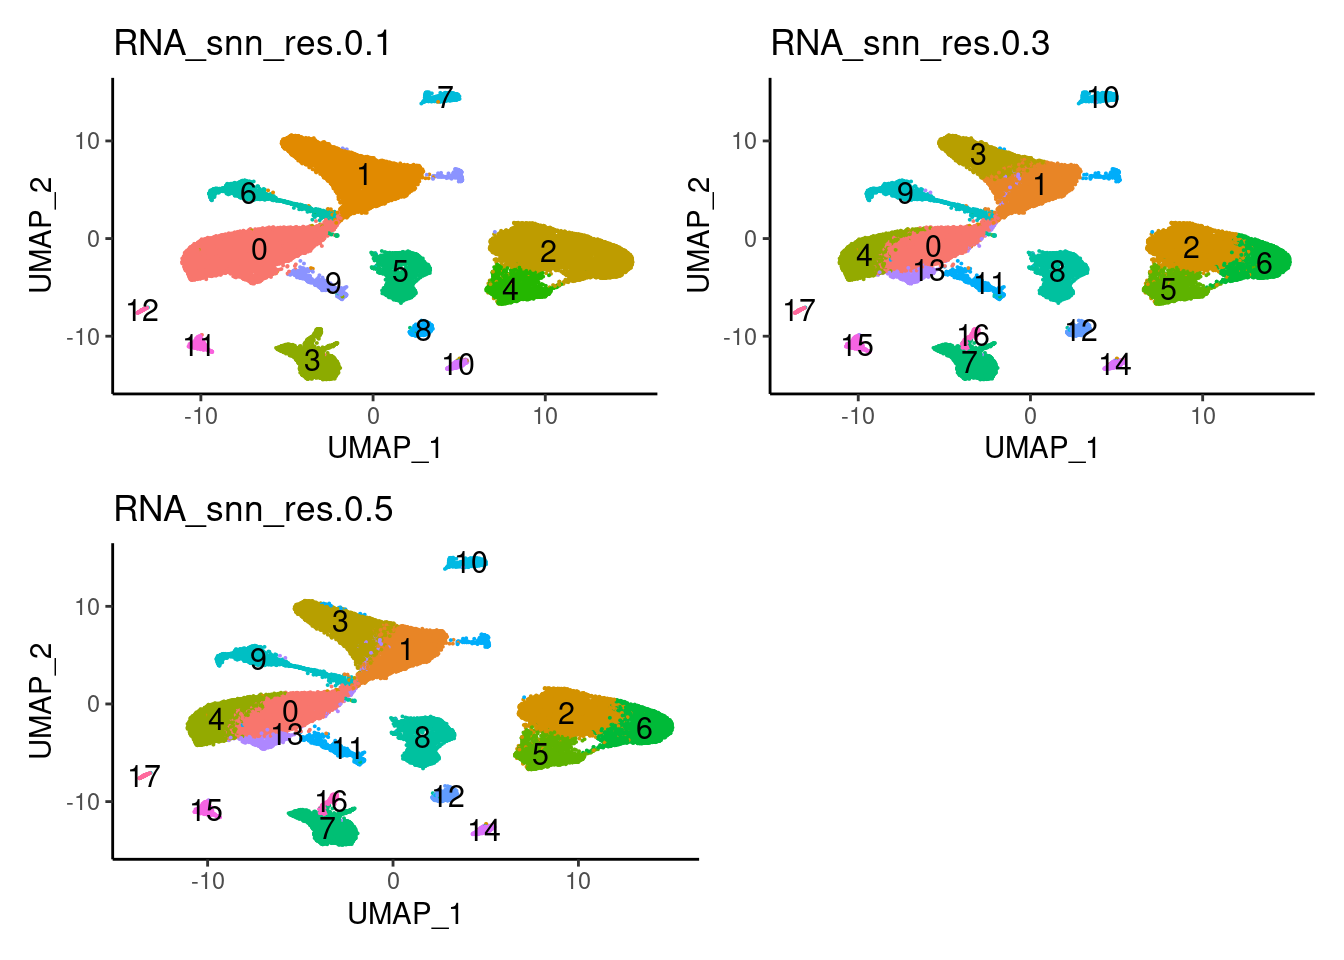
Top5 markers
marker_genes <- read_delim("ALL/filter_65/ALL_markers_resolution_0.1.csv",
                           delim = ";", escape_double = FALSE,
                           locale = locale(decimal_mark = ",", grouping_mark = "."),
                           trim_ws = TRUE)
## Rows: 9064 Columns: 7
## ── Column specification ──────────────────────────────────────────────────────────────────────────────────────────────
## Delimiter: ";"
## chr (1): gene
## dbl (6): p_val, avg_log2FC, pct.1, pct.2, p_val_adj, cluster
##
## ℹ Use `spec()` to retrieve the full column specification for this data.
## ℹ Specify the column types or set `show_col_types = FALSE` to quiet this message.top5 <- marker_genes %>%
dplyr::group_by(cluster)%>%
dplyr::slice(1:5)
top5_g <- unique(top5$gene)
DotPlot(seudataf, features = top5_g, group.by = 'RNA_snn_res.0.1' ) + theme_classic() + theme(axis.text.x = element_text(angle=90), axis.title = element_blank()) + NoLegend() + labs(title = 'Resolution 0.1')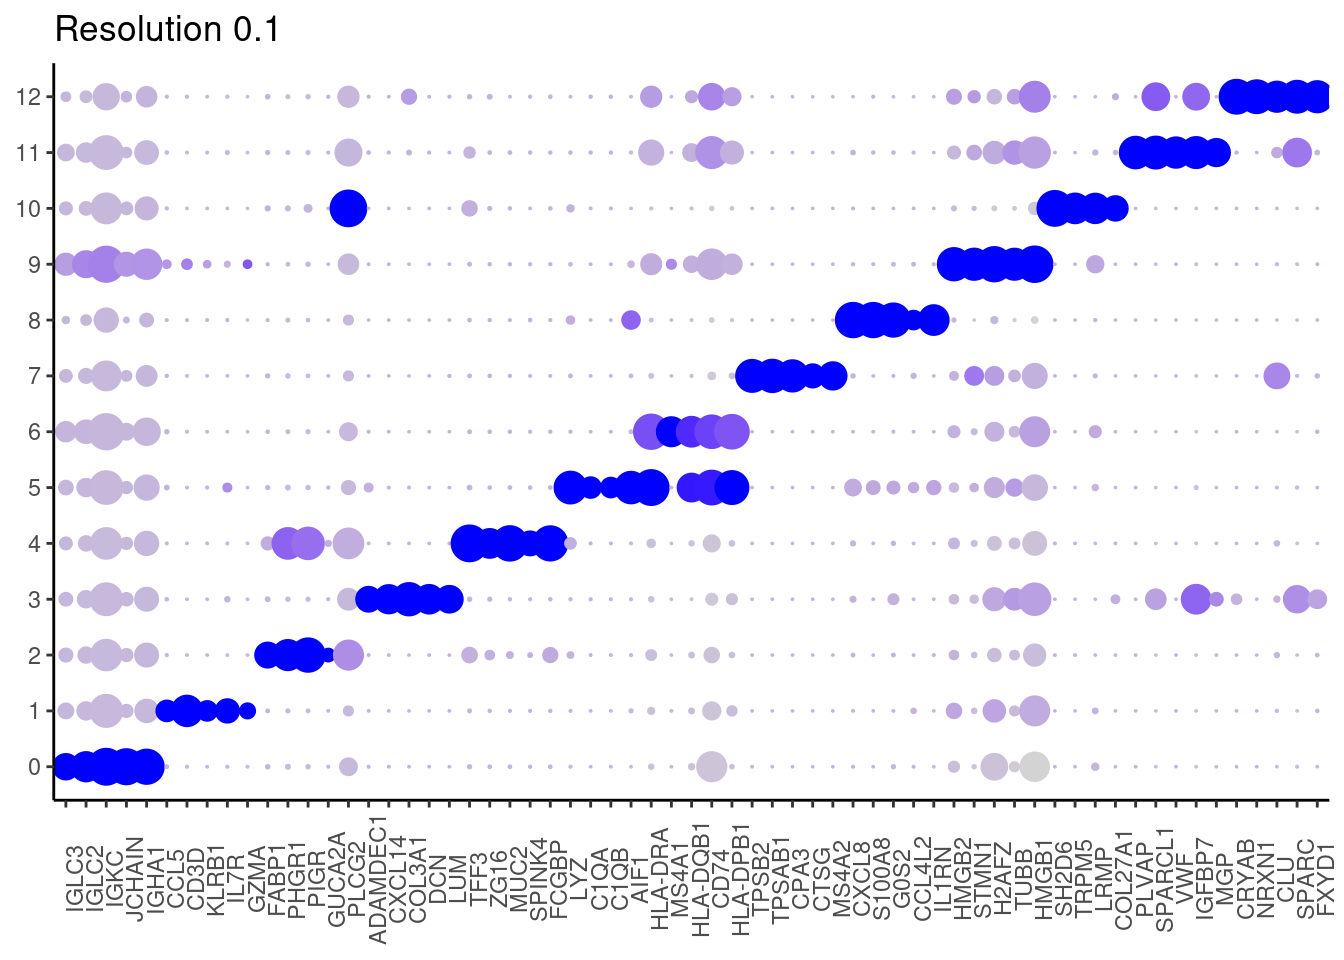
Bibliography genes
subset_genes <- data.frame(
stringsAsFactors = FALSE,
gene = c("BANK1","CD19","CD79A","DERL3", # b and plasma
"MS4A1","MZB1",
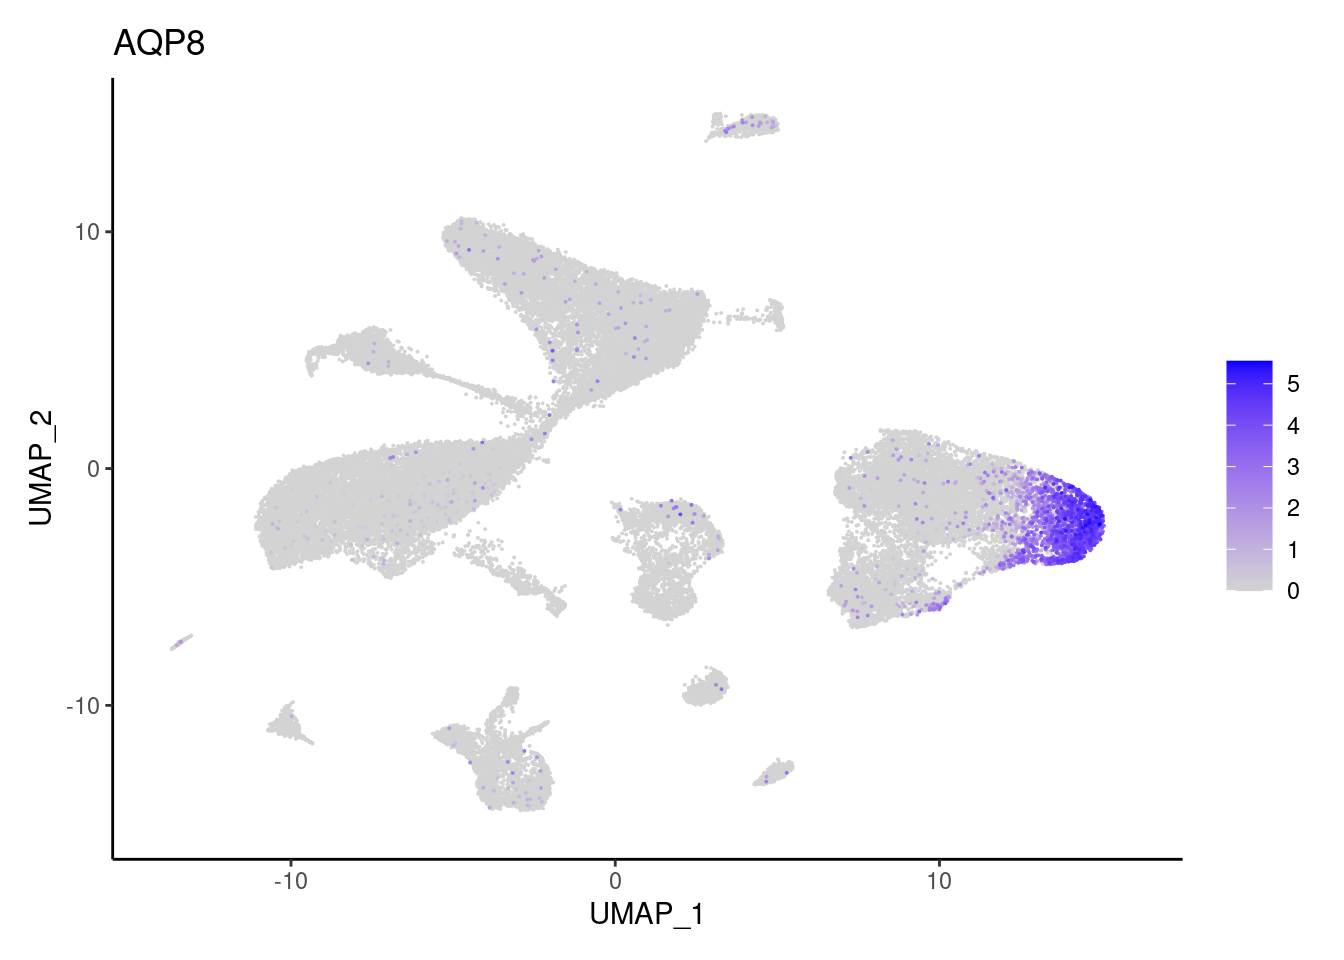
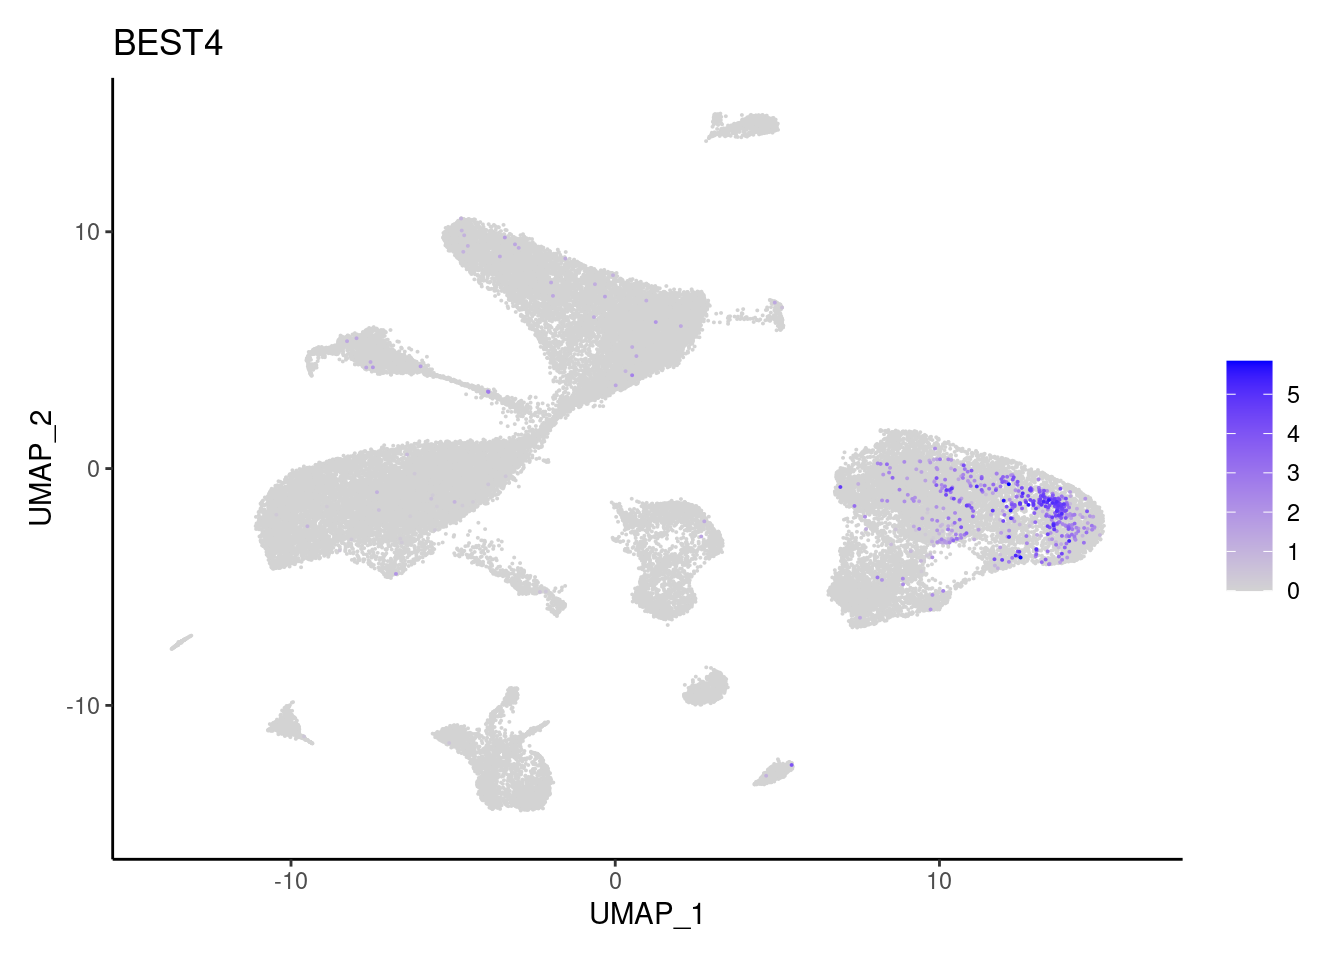
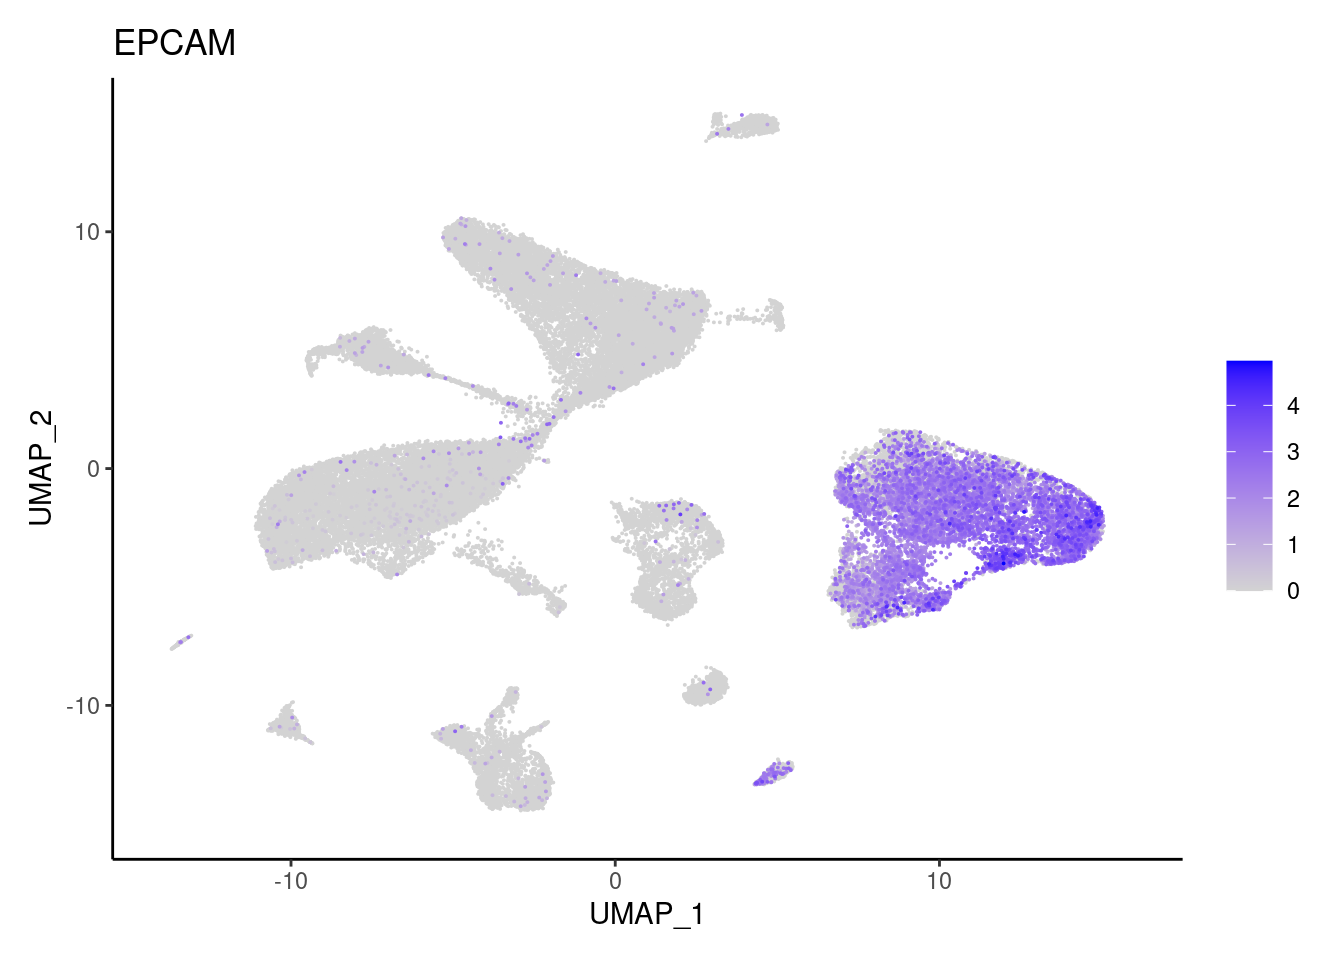
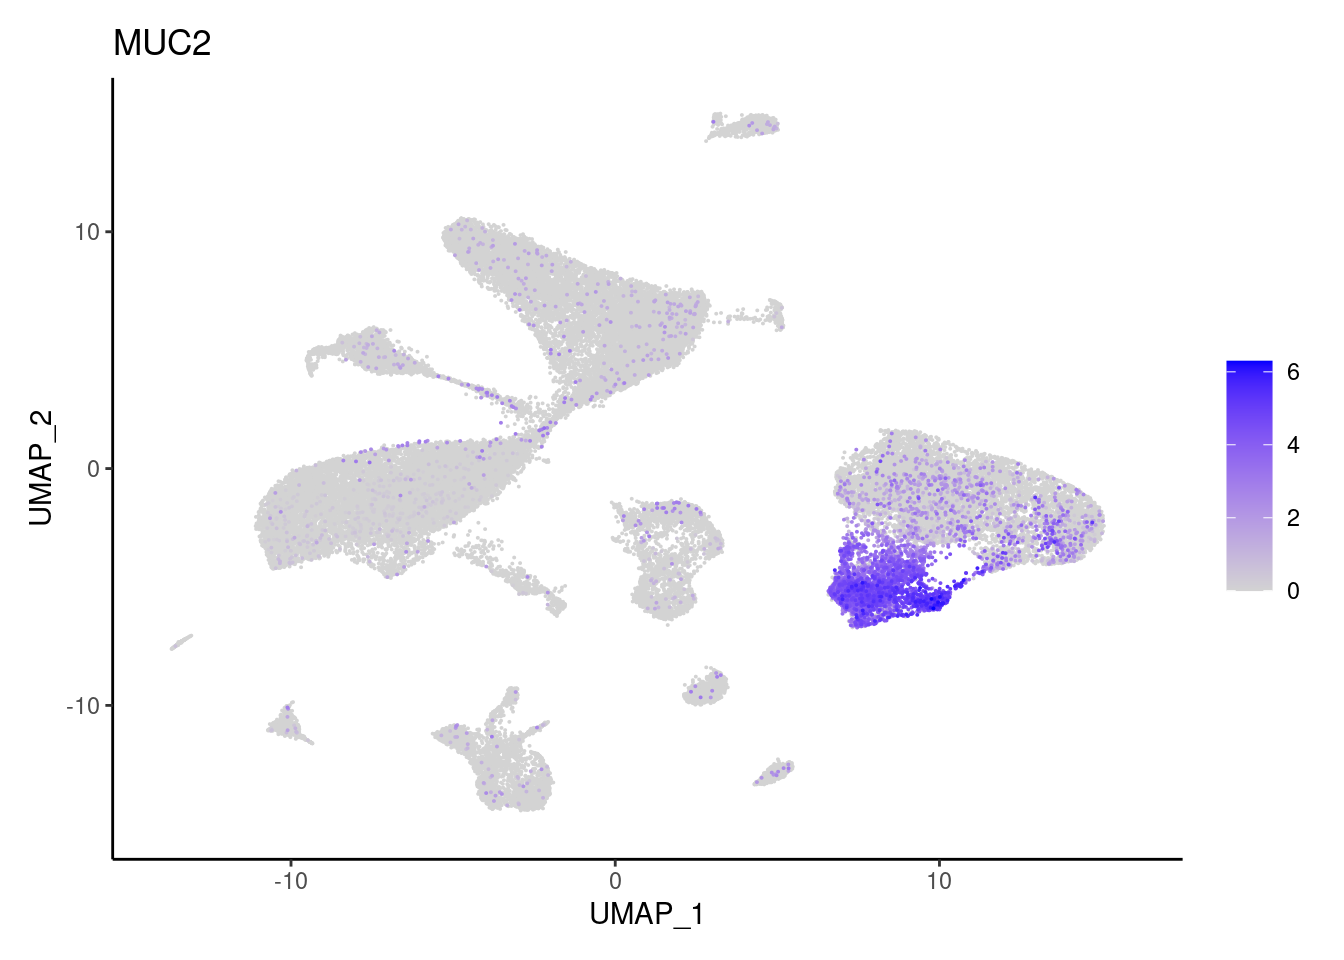
"AQP8","BEST4", "EPCAM","MUC2", # epi
"OLFM4","TRPM5", "ZG16",
"AIF1","C1QA","C1QB","CD14", # myeloids
"CMTM2","FCGR3B","LYZ","MS4A2",
"TPSAB1","TPSB2", 'CPA3',
'CD14', 'CD163', 'CSF1R', 'CD68',
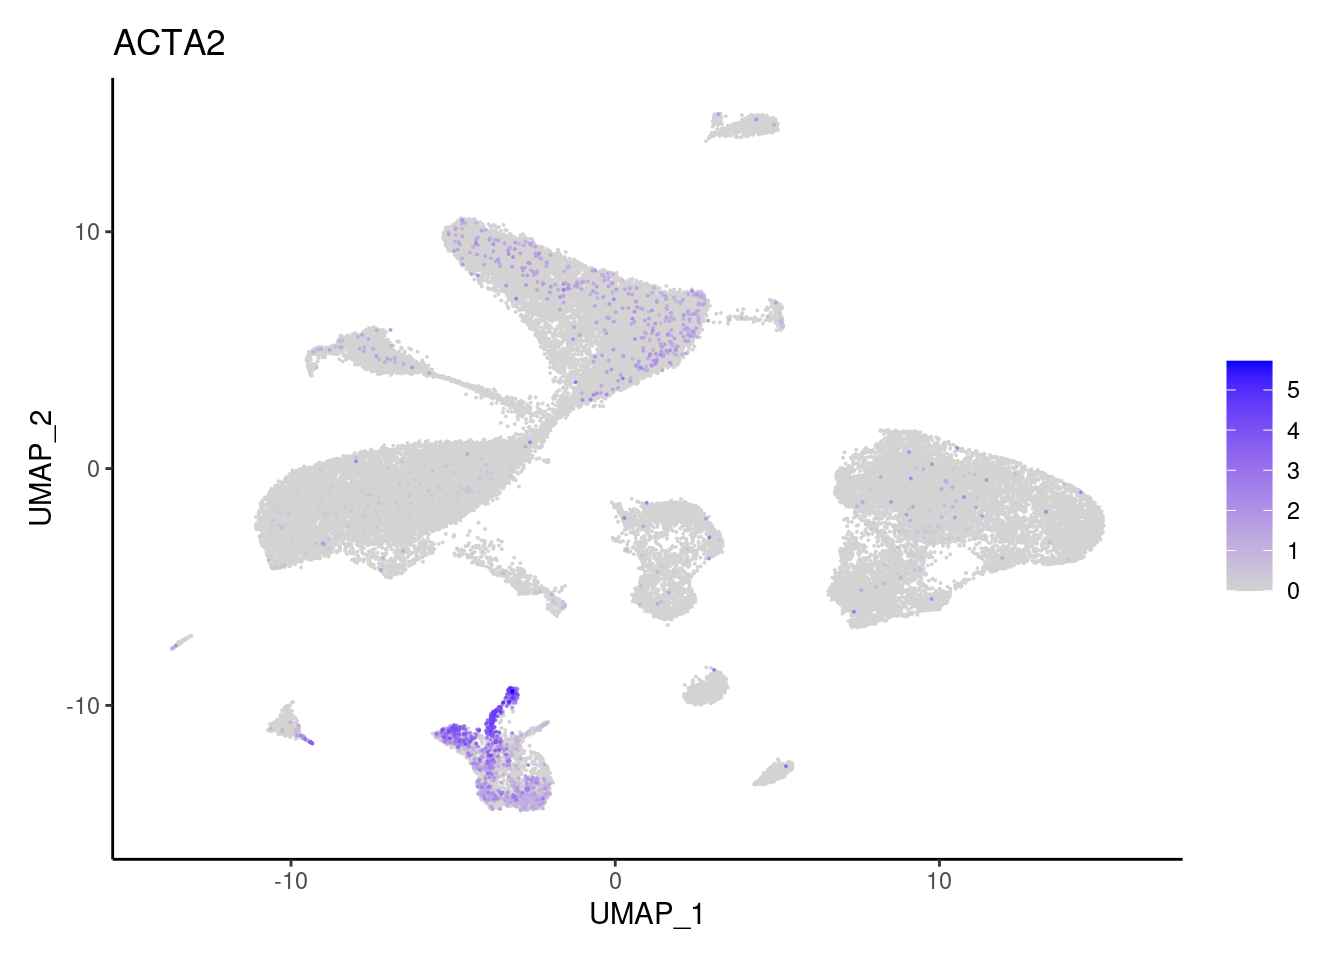
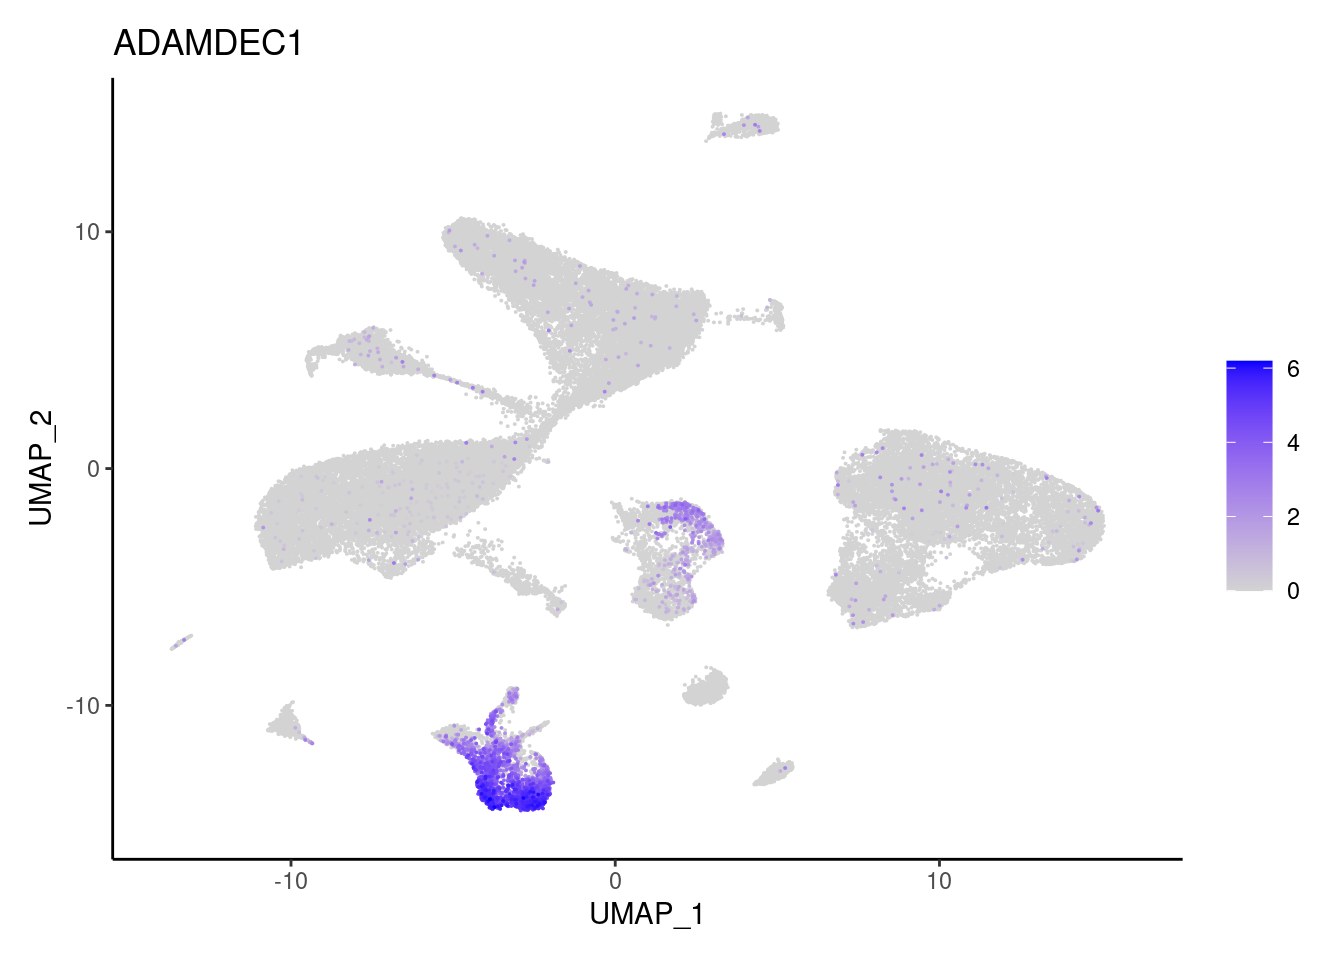
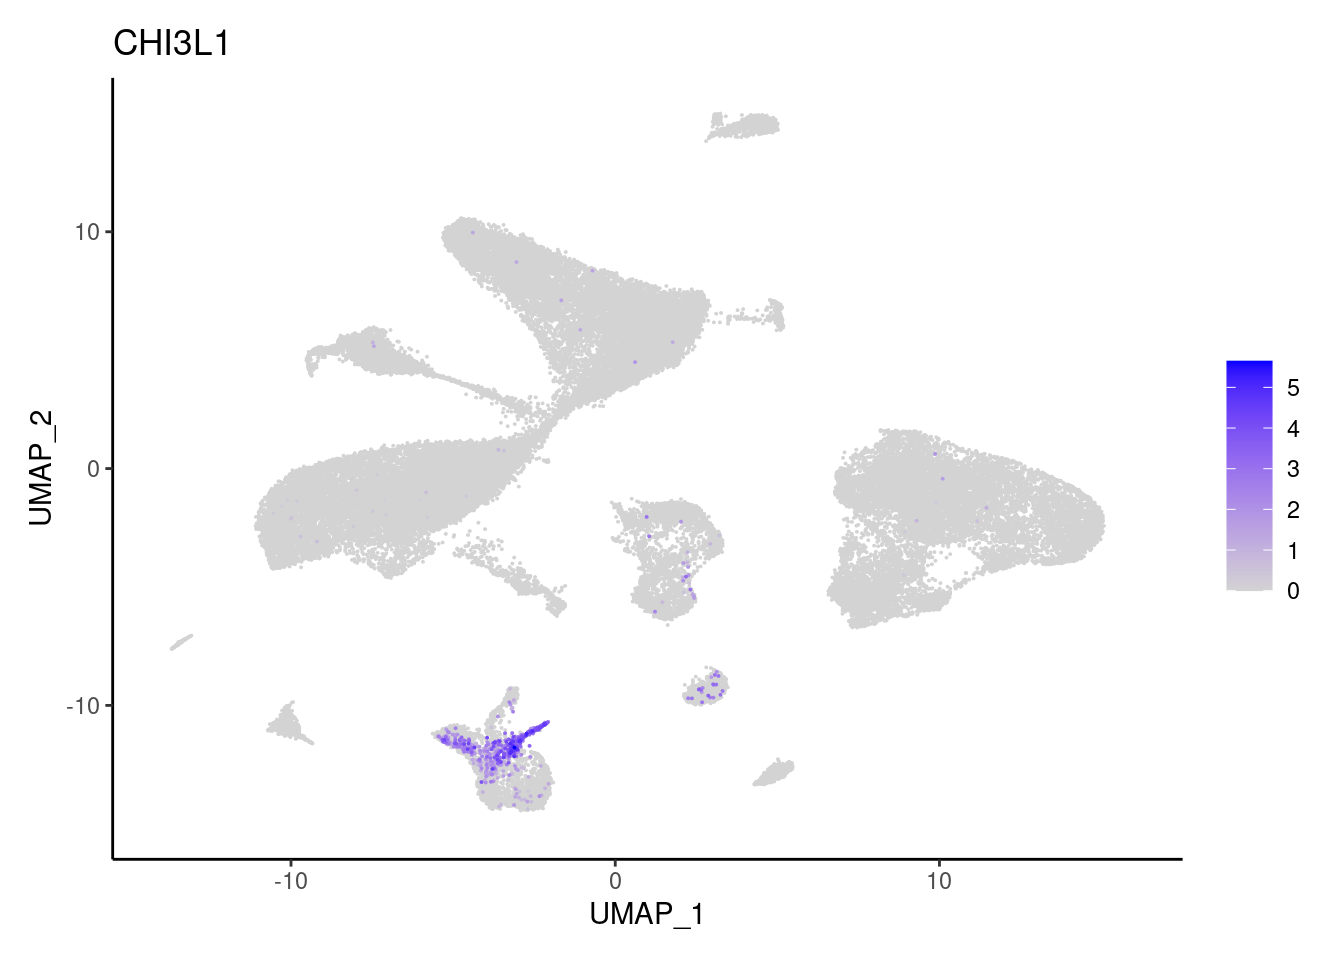
"ACTA2","ADAMDEC1","CHI3L1", # stroma
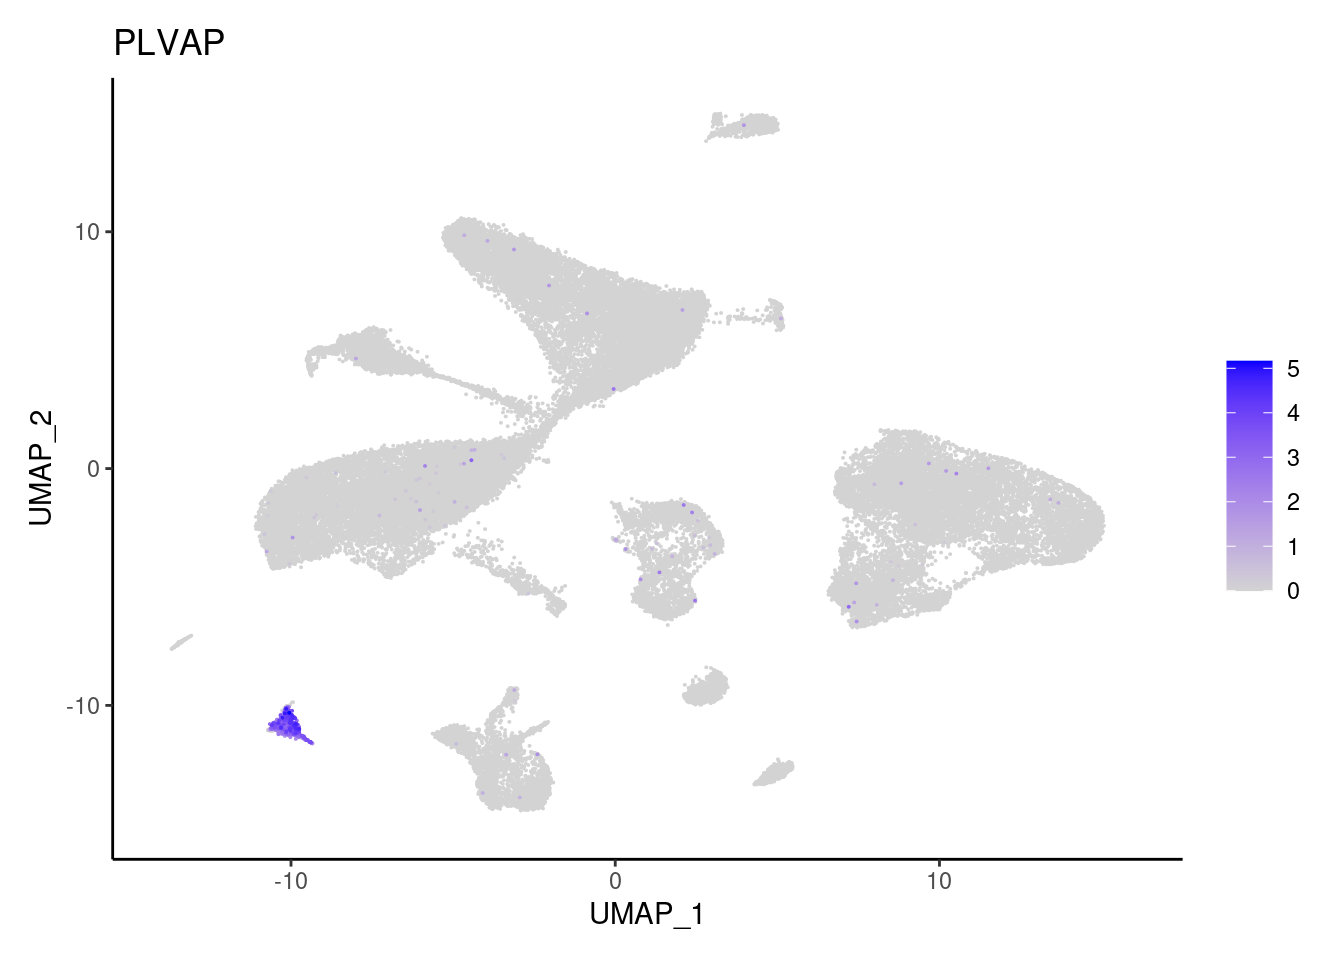
"COL3A1","NRXN1","PLVAP","SOX6",
"VWF",
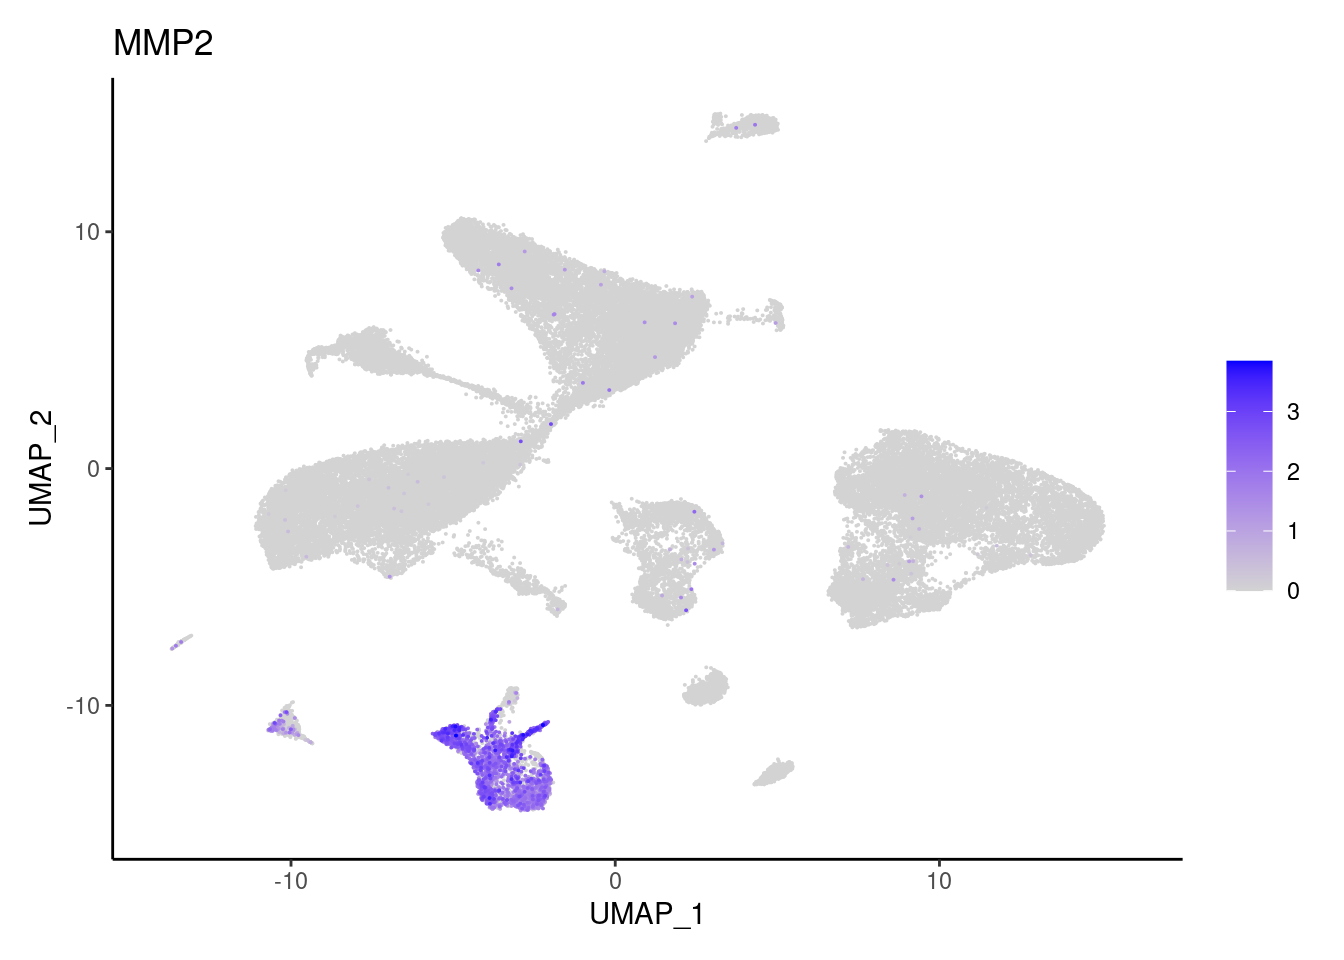
'PDGFRA', 'PDGFRB', 'PTGDS', 'LUM', 'MMP2',
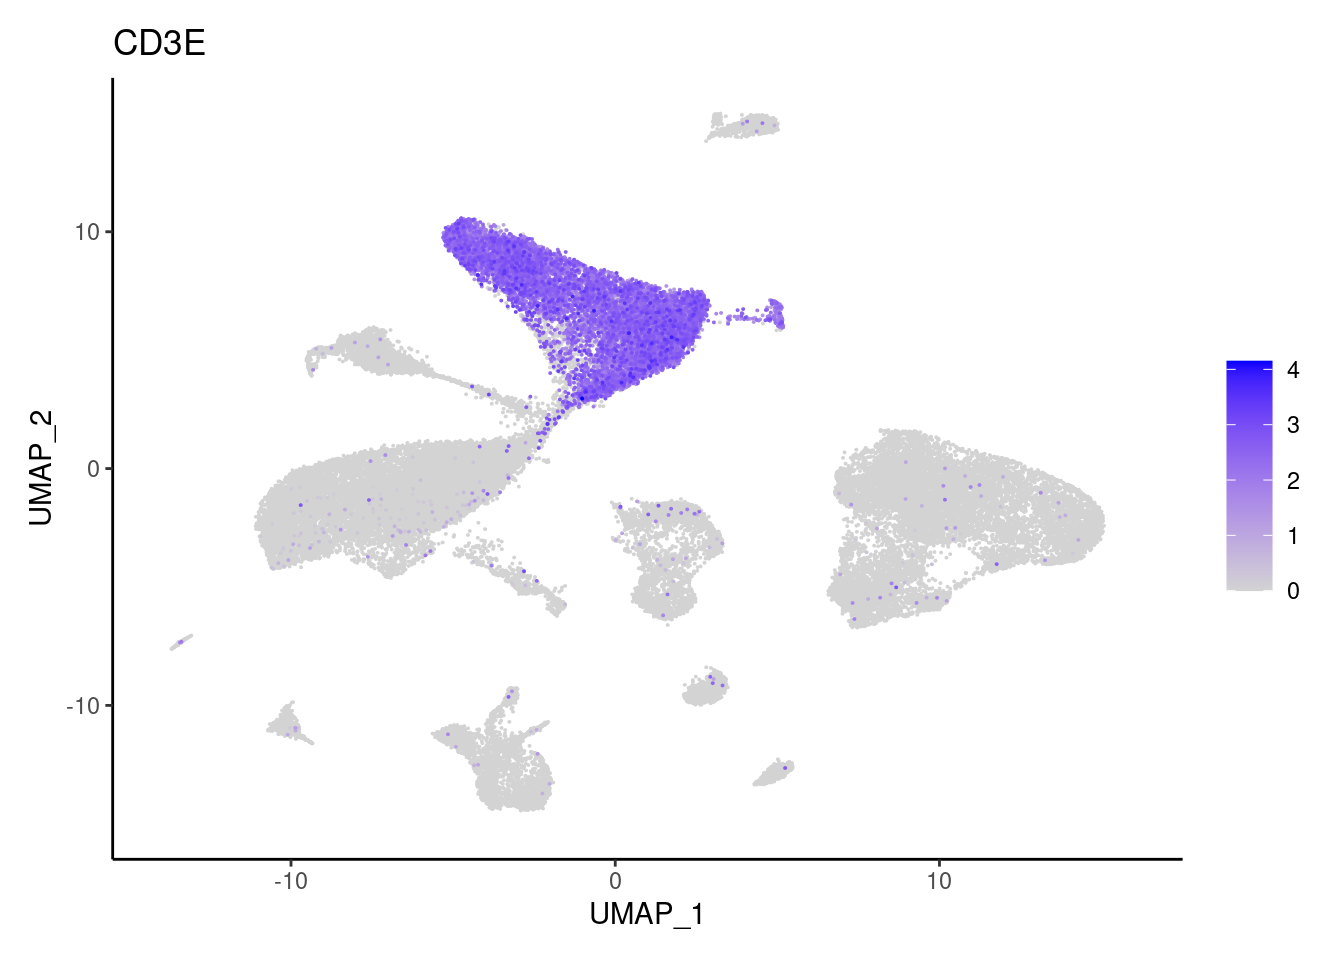
"CD3D","CD3E","CD3G", # tcells
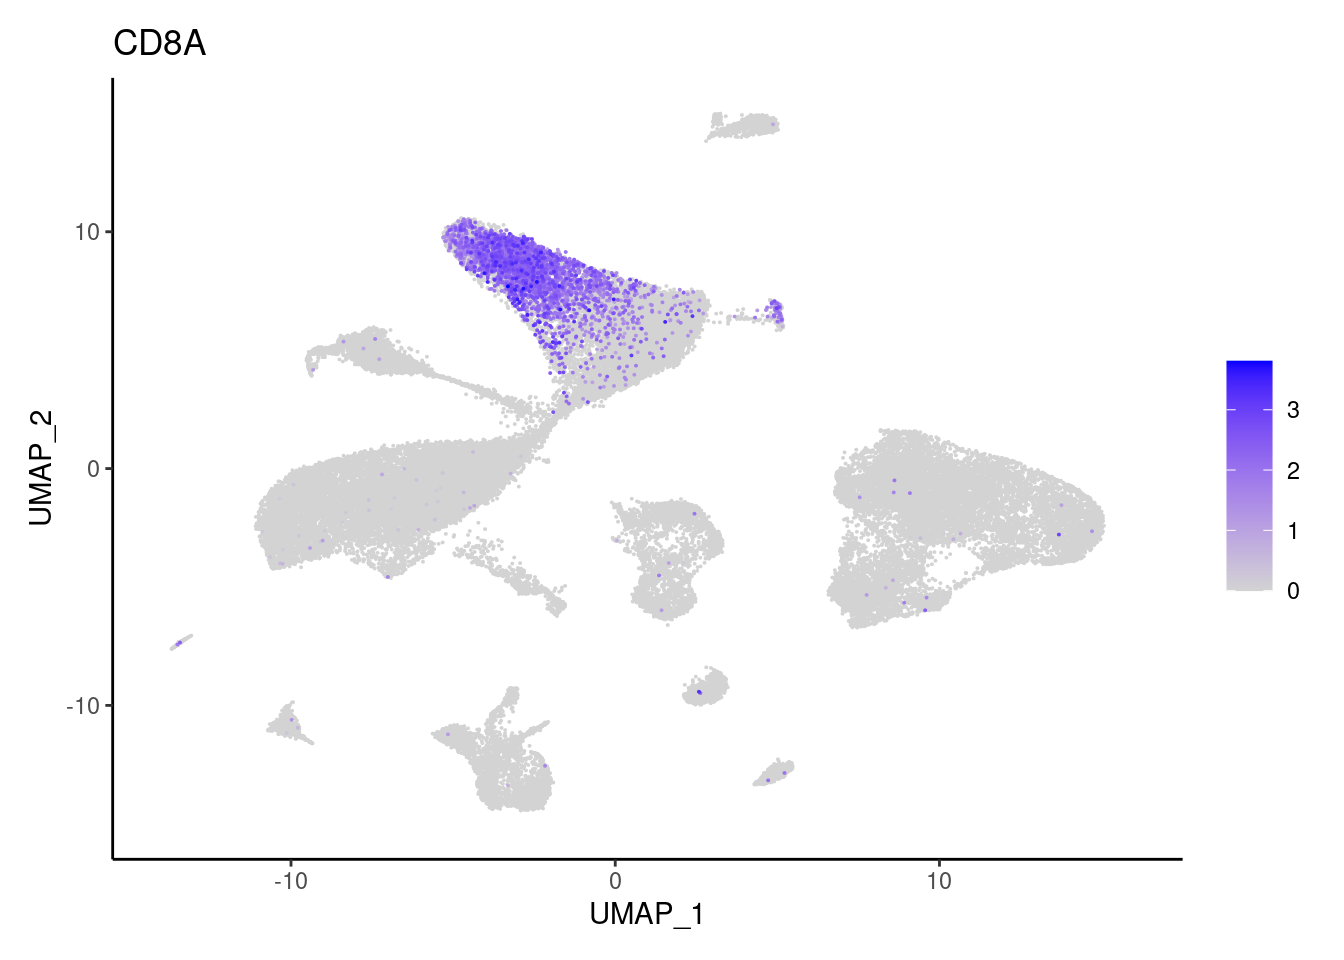
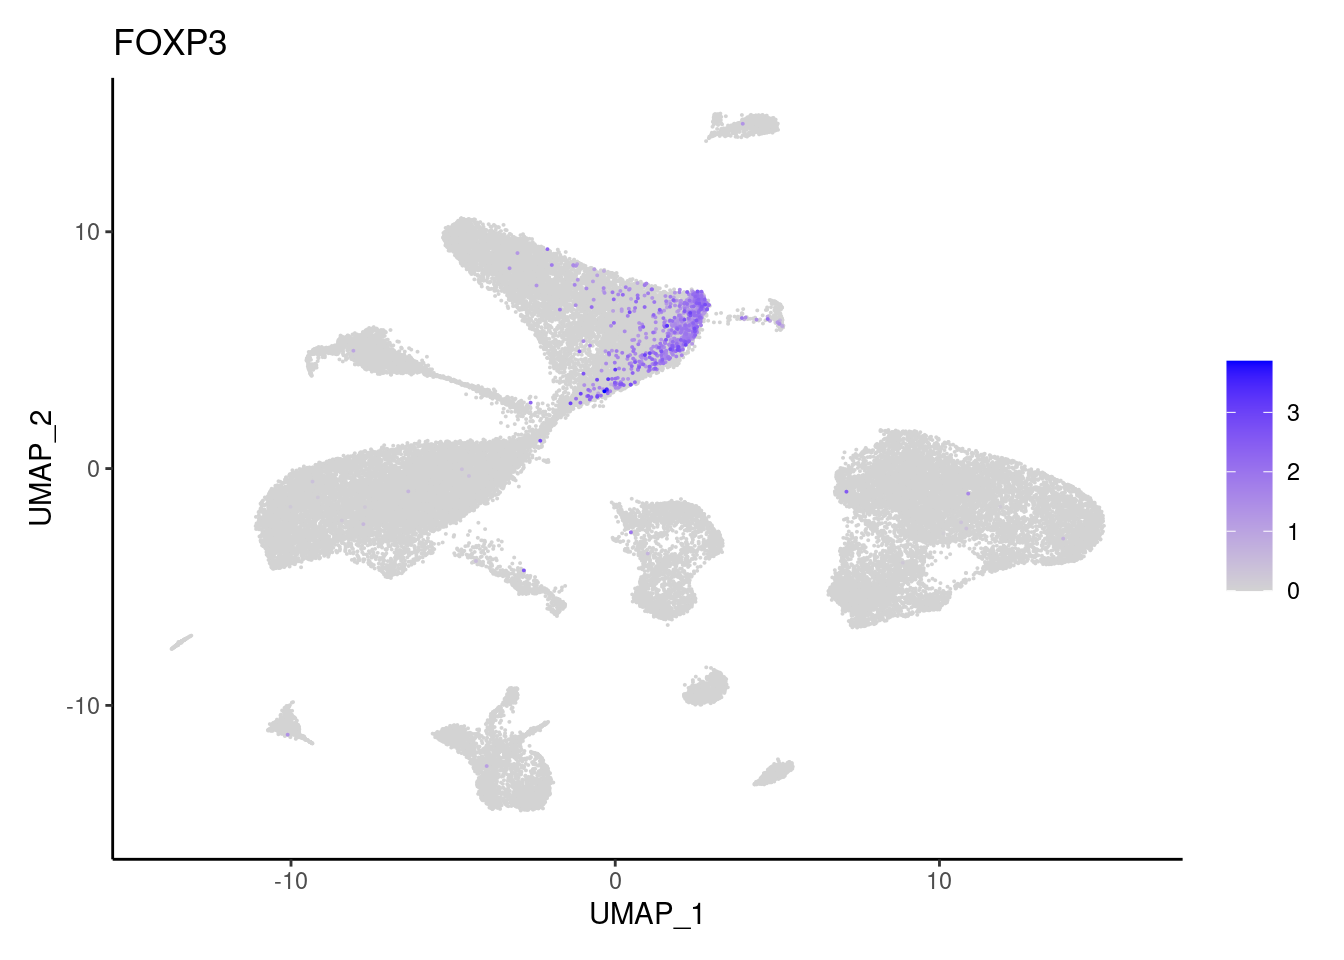
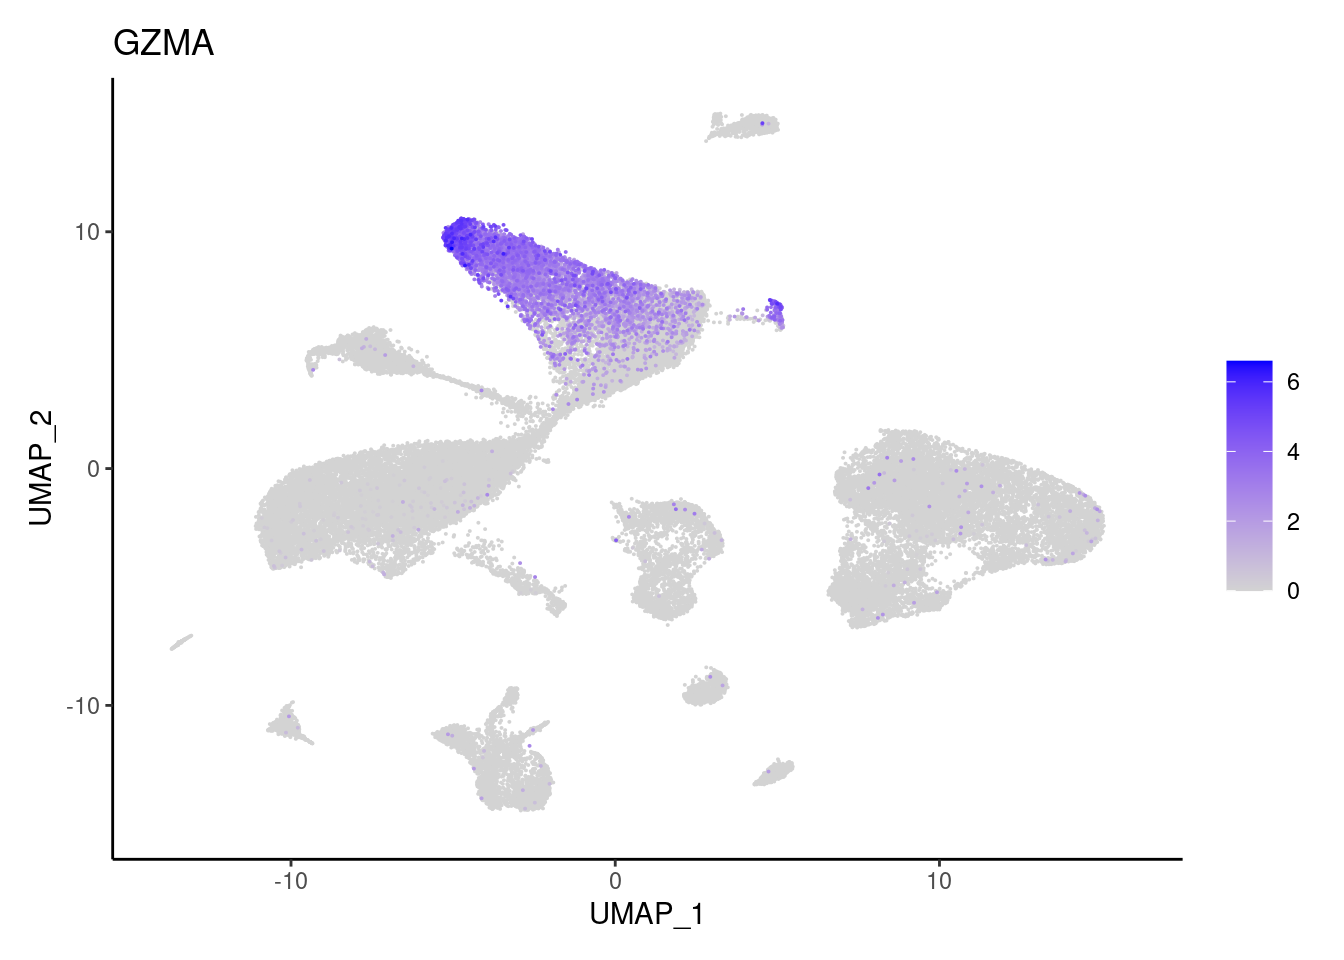
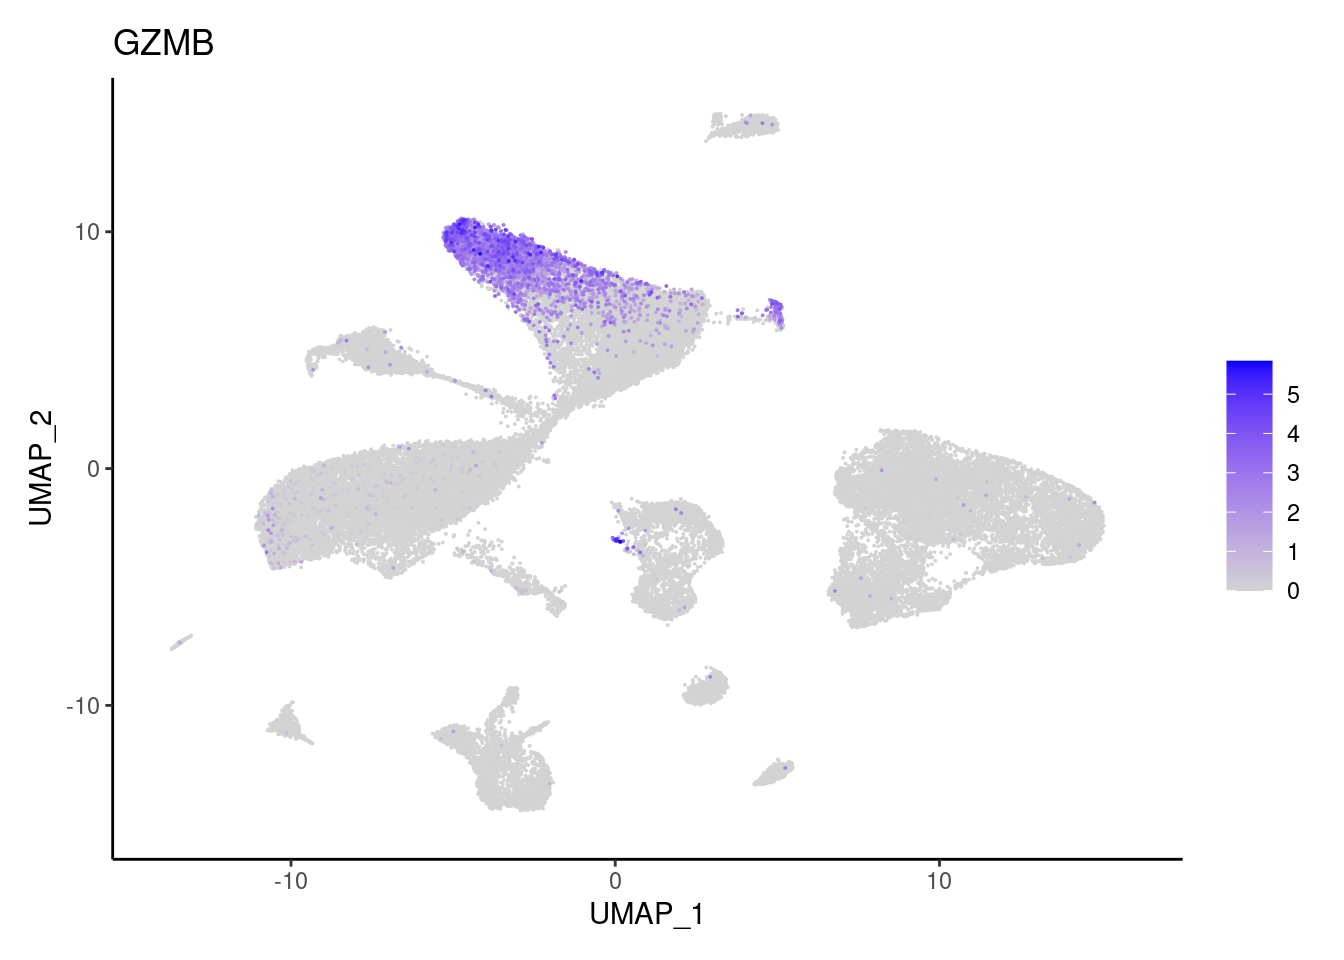
"CD8A","FOXP3","GZMA","GZMB",
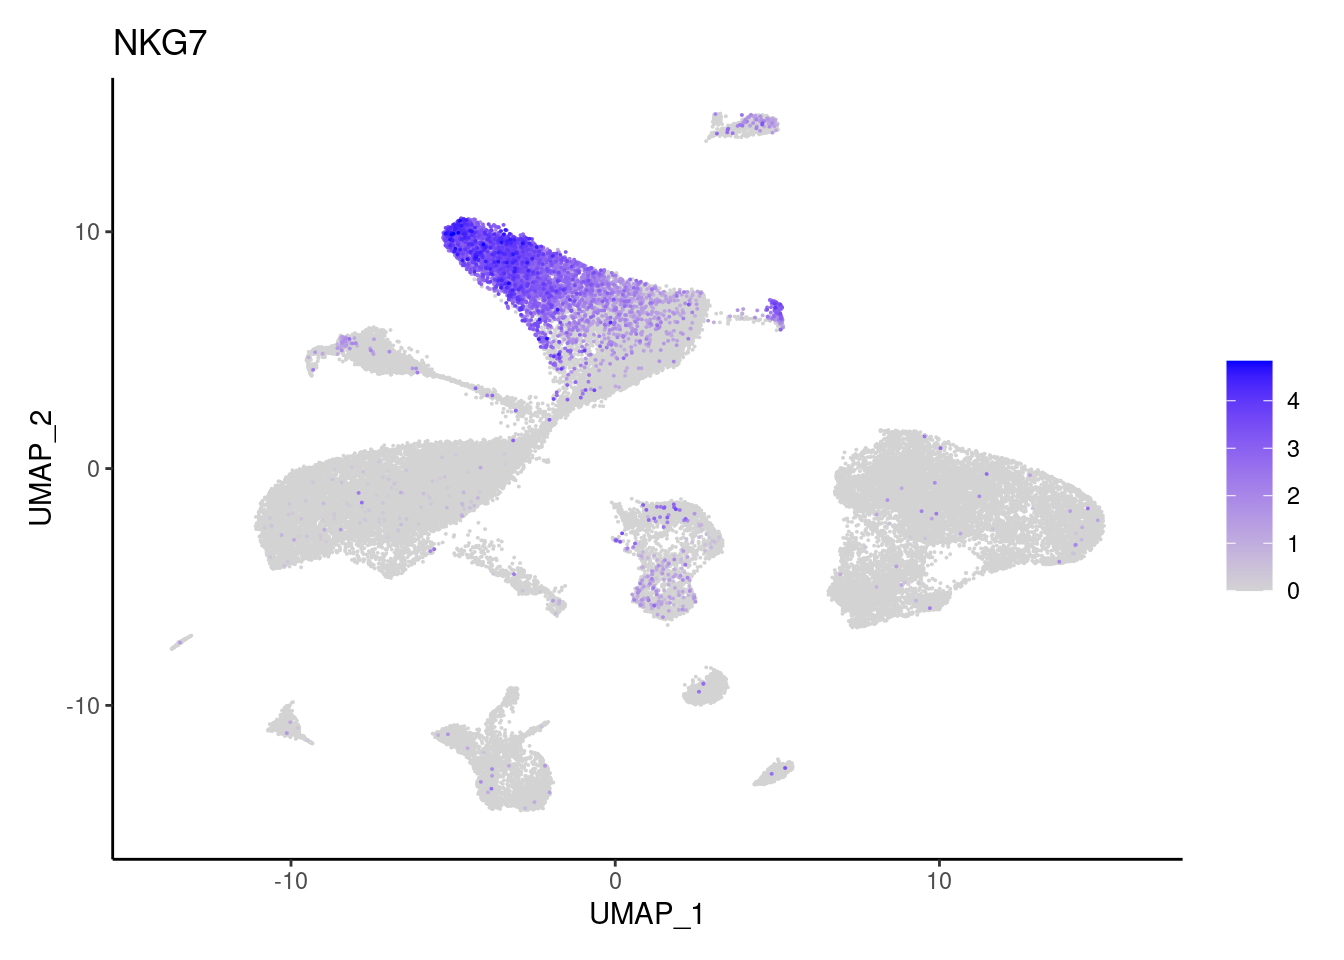
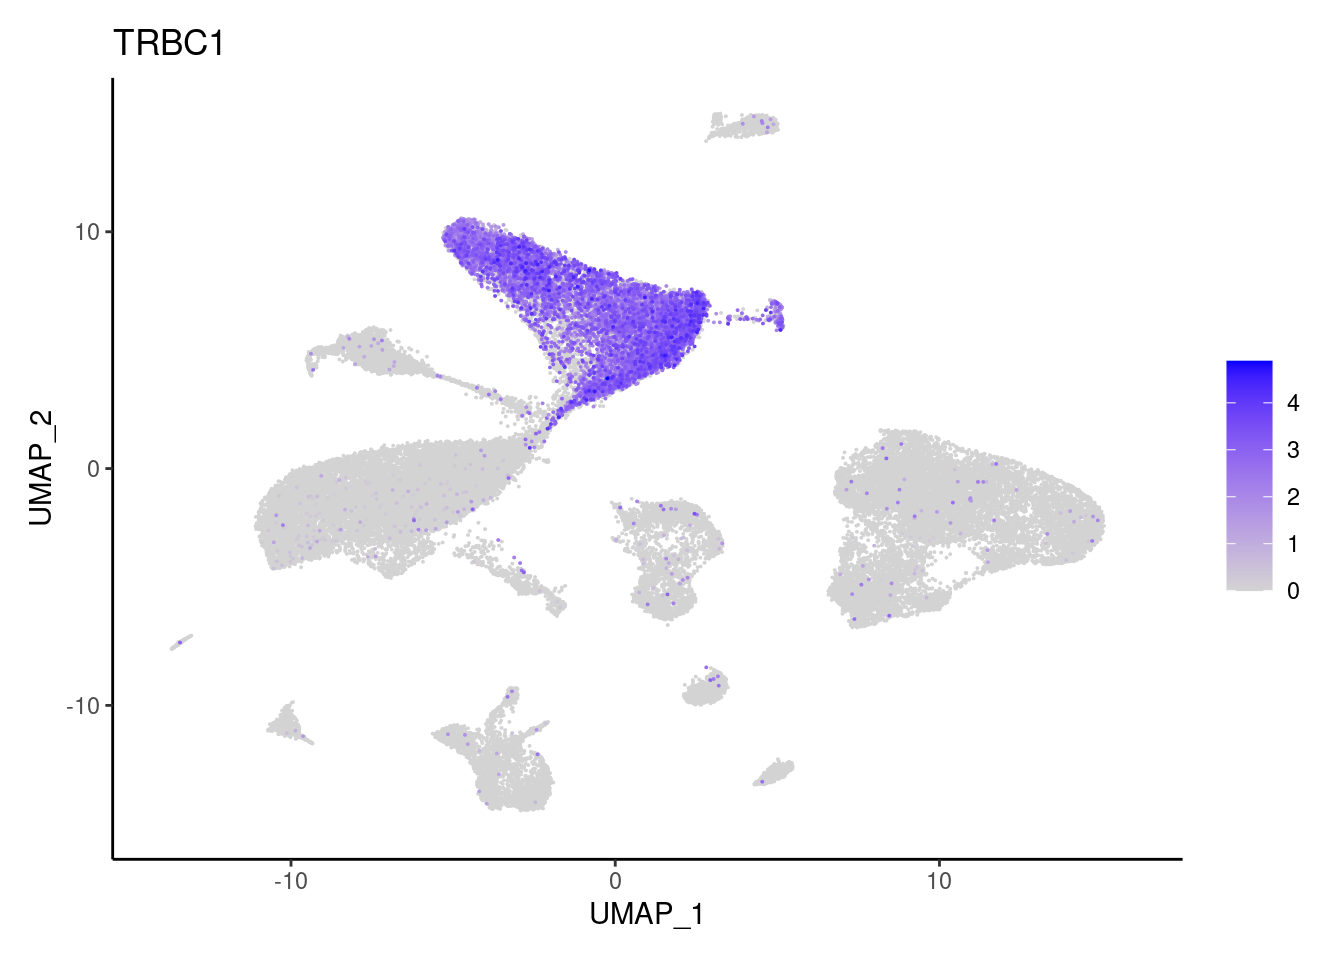
"TRAC", "NKG7","TRBC1",
'KLRB1'),
subset = c("B and plasmacells","B and plasmacells",
"B and plasmacells",
"B and plasmacells","B and plasmacells",
"B and plasmacells",
"Epithelium",
"Epithelium","Epithelium",
"Epithelium","Epithelium",
"Epithelium","Epithelium",
"Myeloid cells","Myeloid cells","Myeloid cells",
"Myeloid cells","Myeloid cells","Myeloid cells",
"Myeloid cells","Myeloid cells","Myeloid cells",
"Myeloid cells","Myeloid cells","Myeloid cells",
"Myeloid cells","Myeloid cells","Myeloid cells",
"Stromal cells","Stromal cells",
"Stromal cells","Stromal cells","Stromal cells",
"Stromal cells","Stromal cells","Stromal cells",
"Stromal cells","Stromal cells","Stromal cells",
"Stromal cells","Stromal cells",
"T cells","T cells",
"T cells","T cells","T cells",
"T cells","T cells","T cells",
"T cells","T cells", 'NK or NKT cells')
)
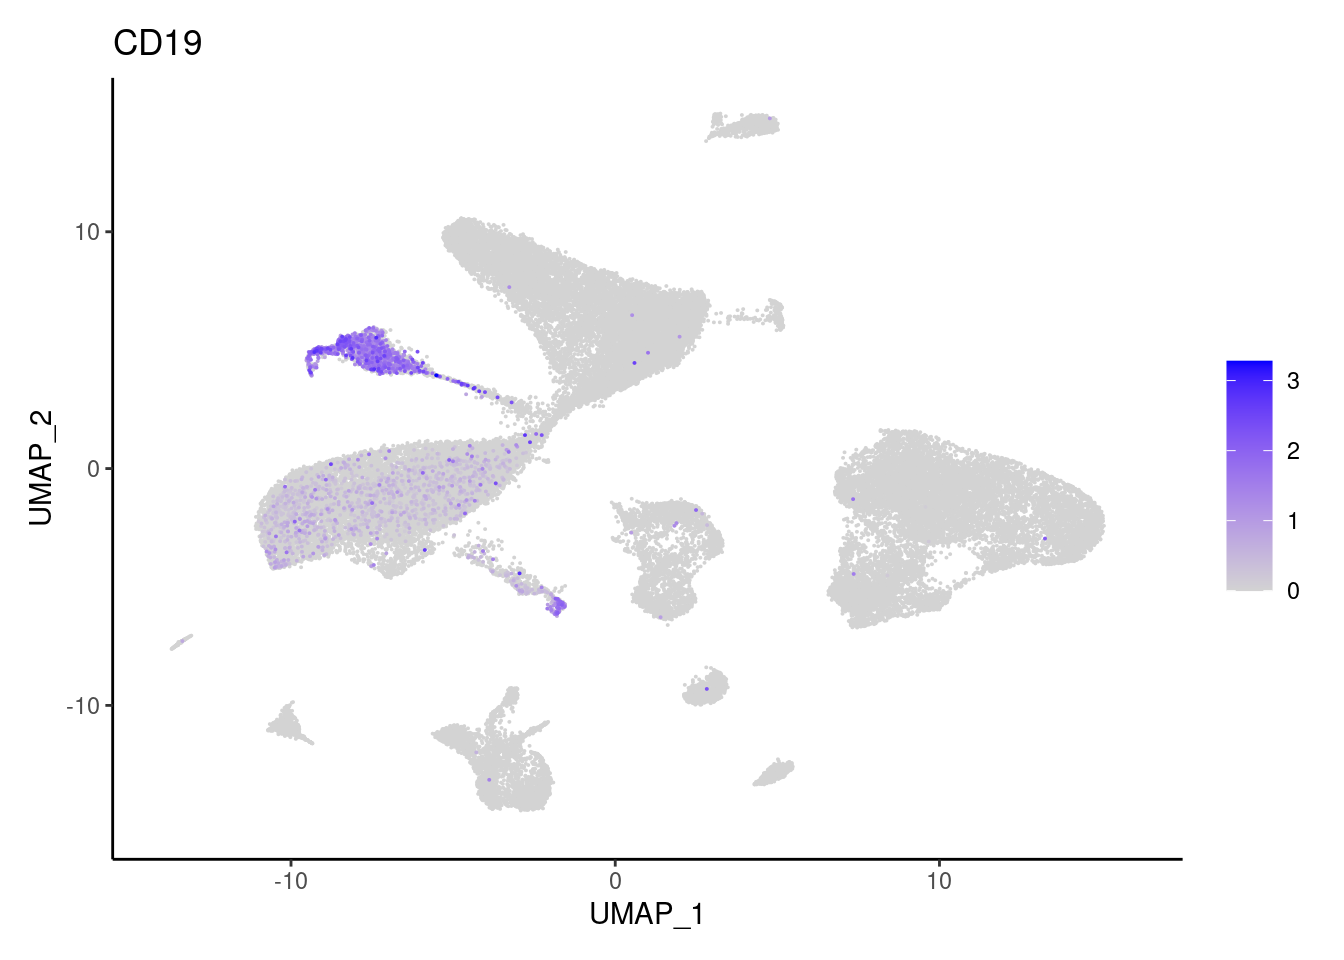
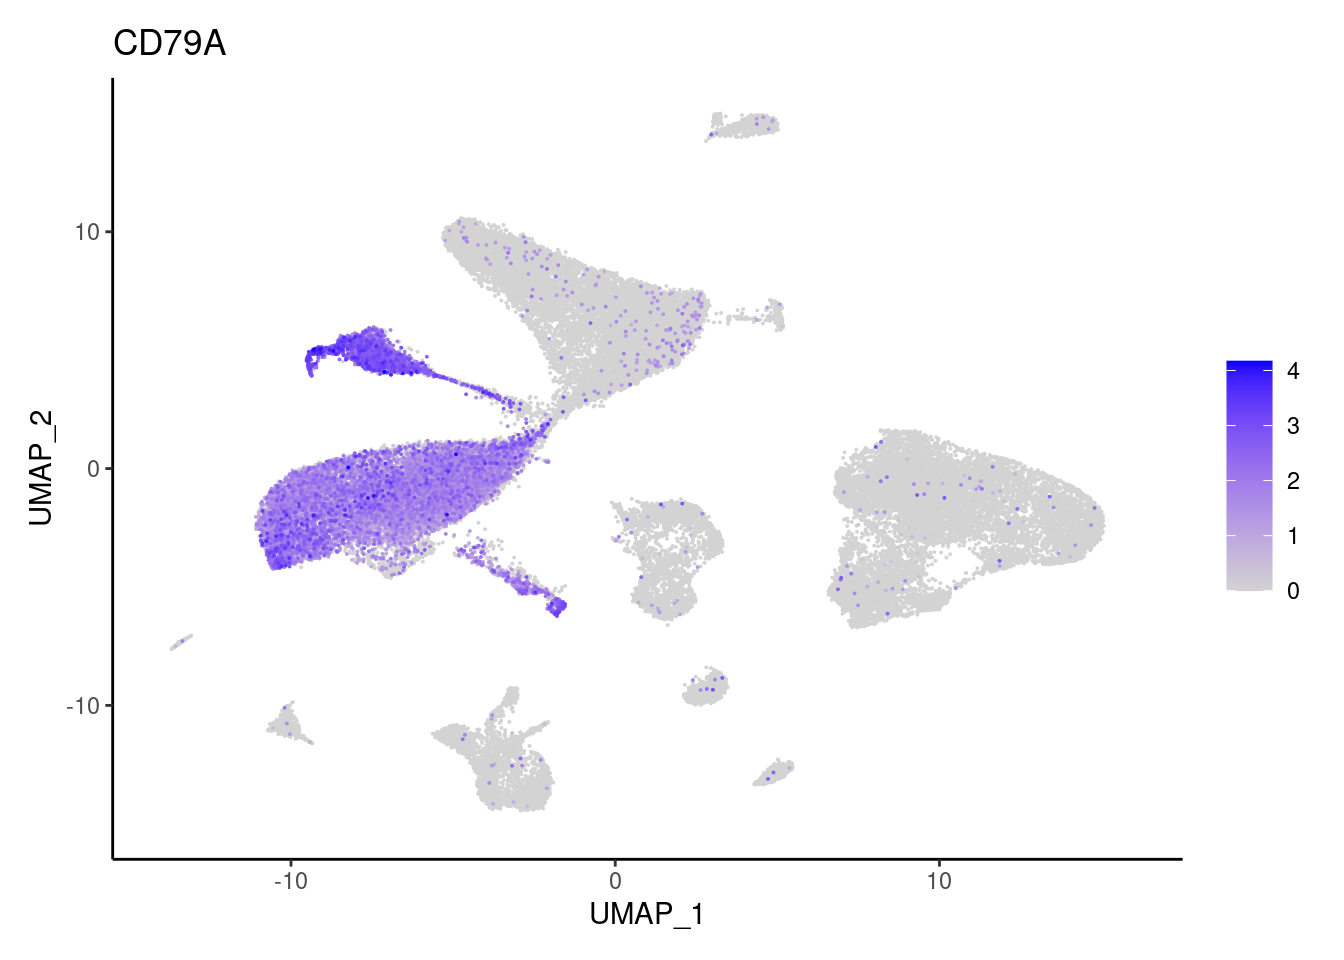
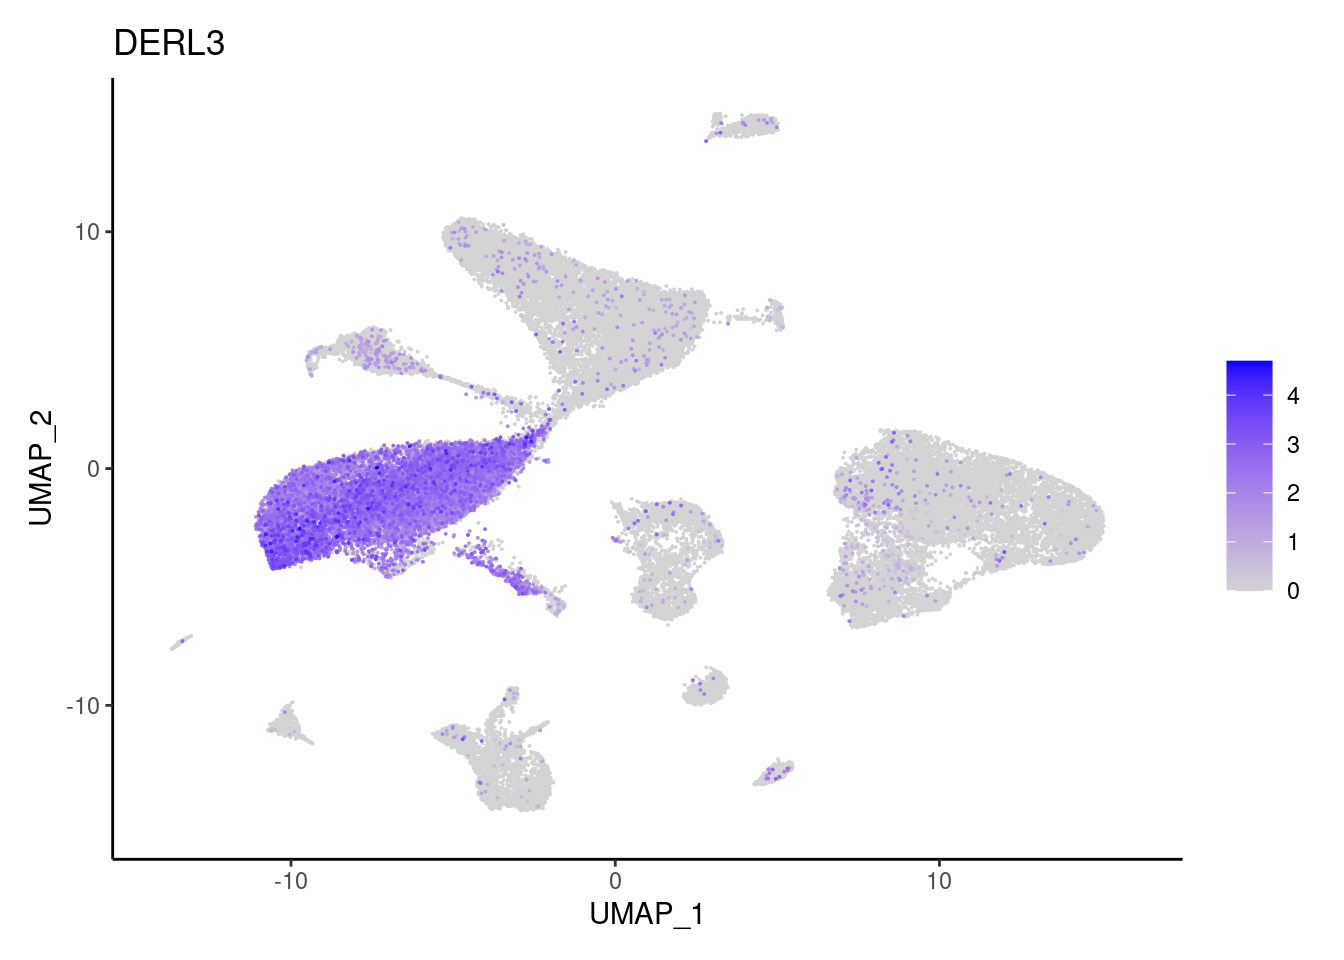
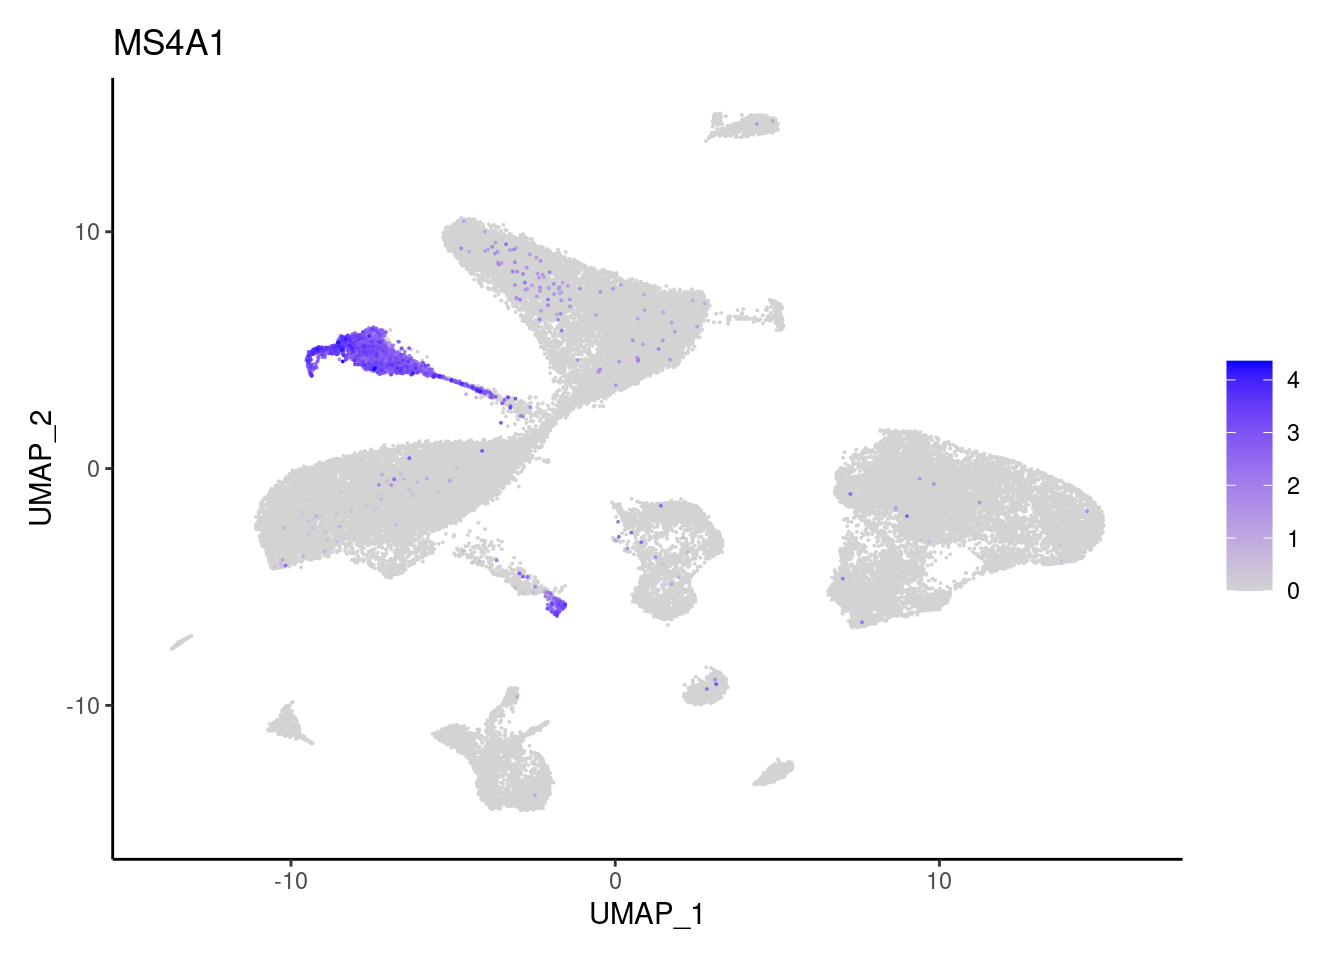
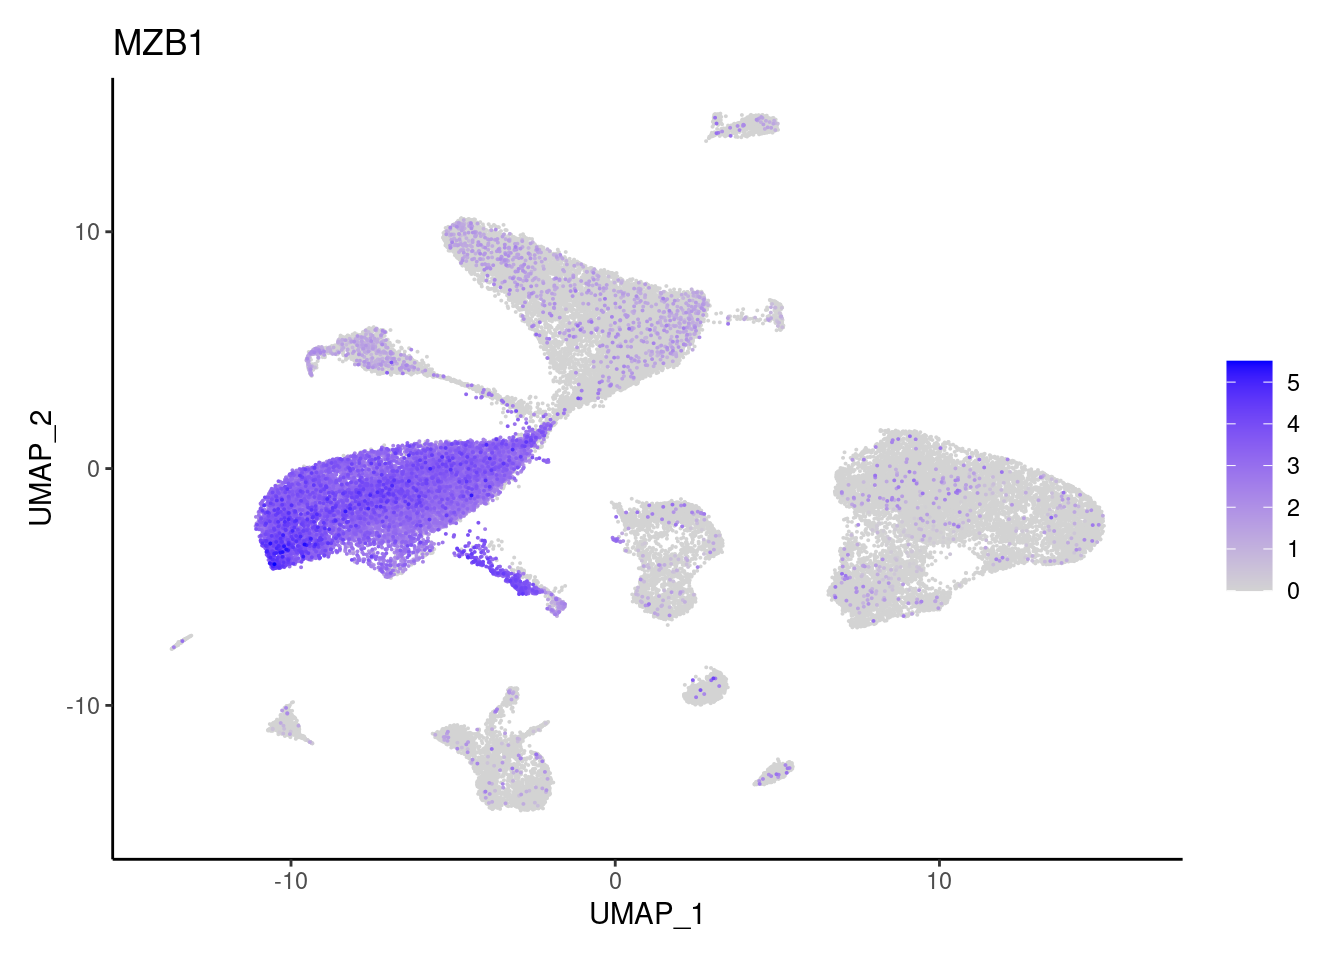
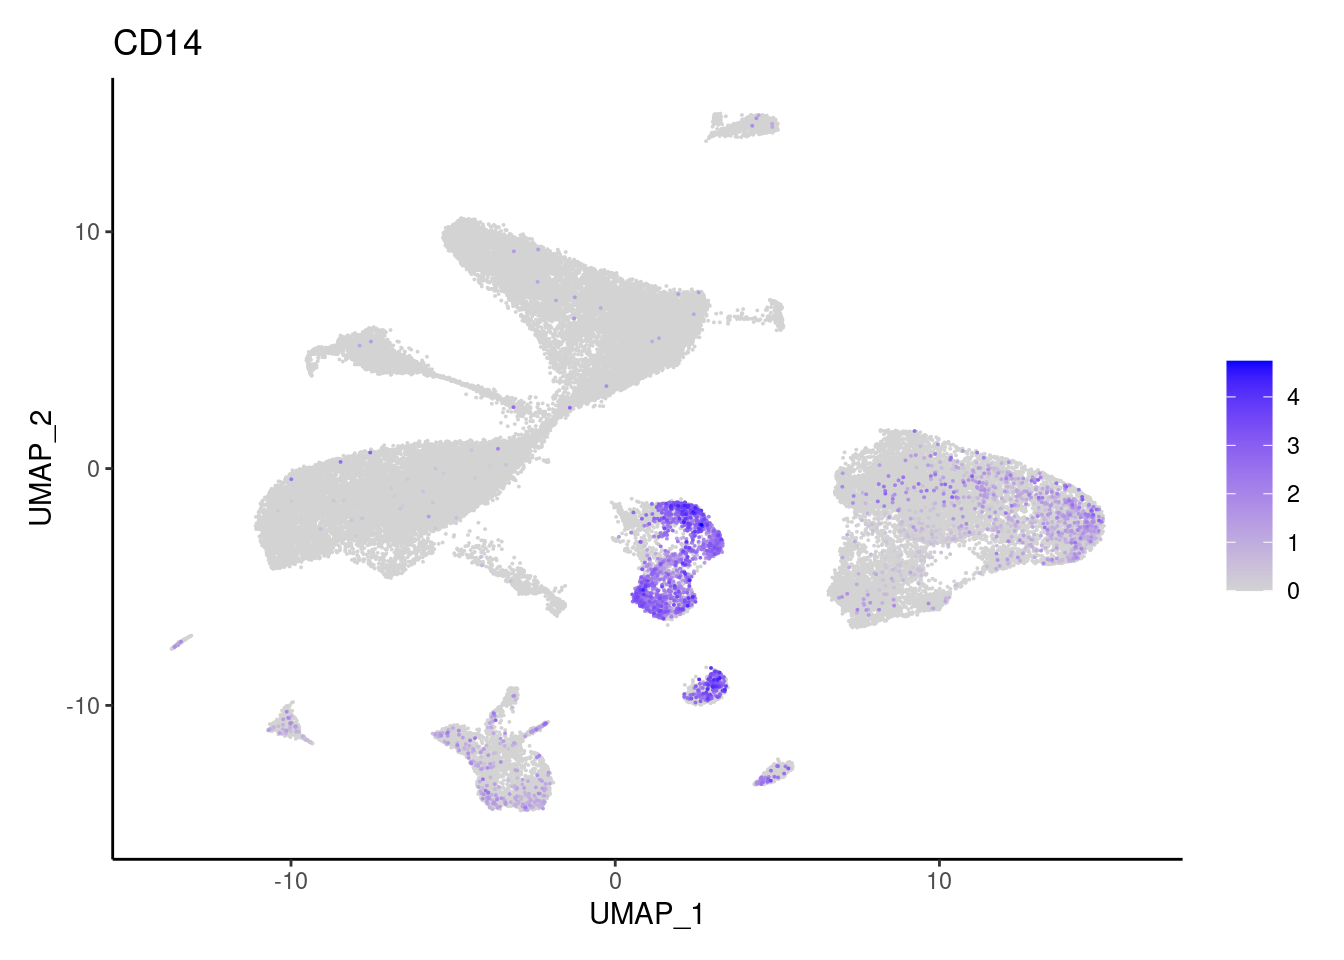
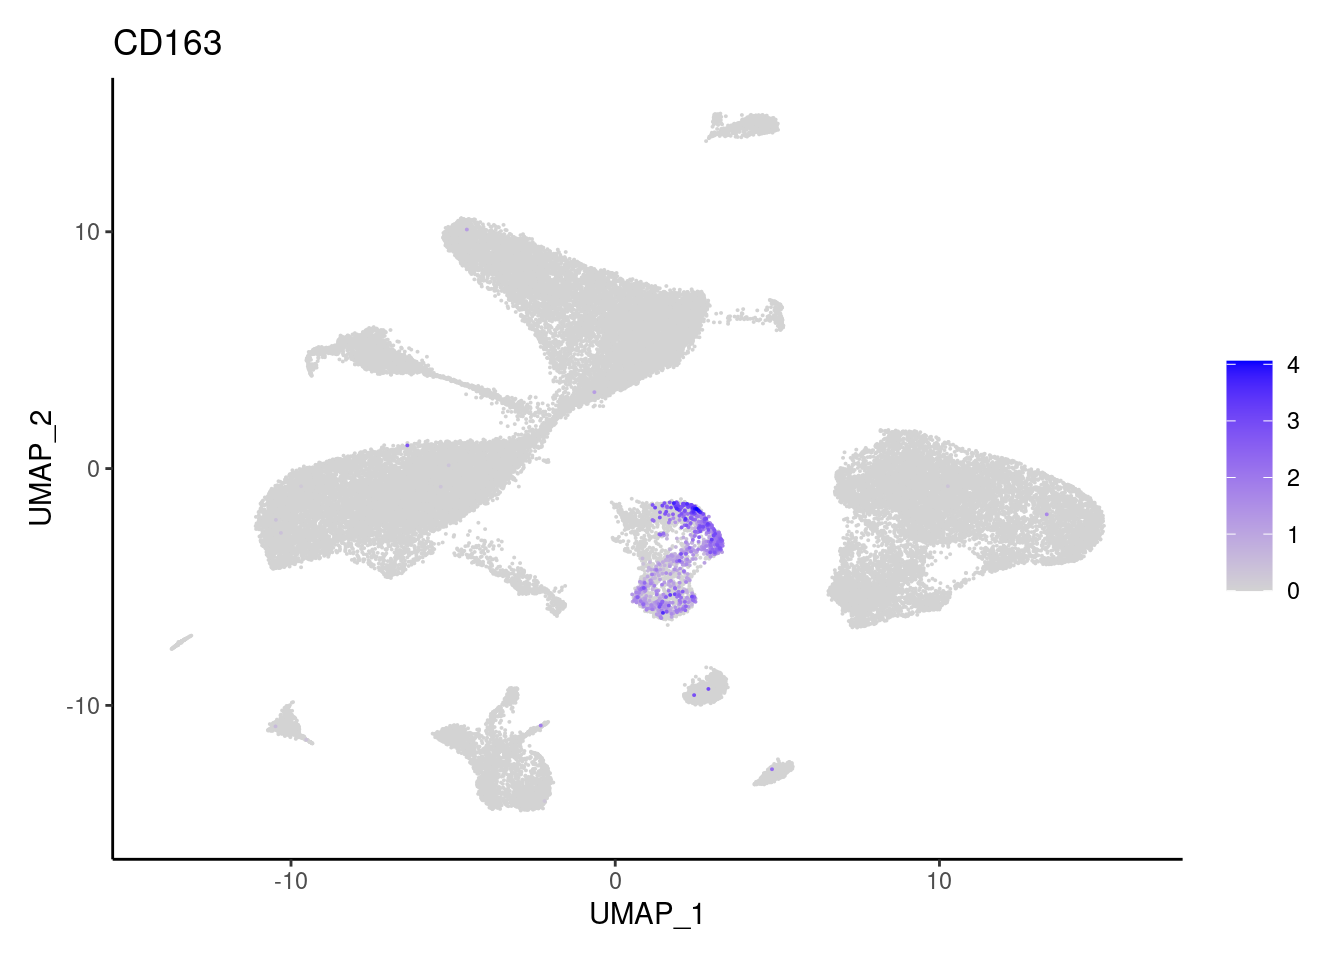
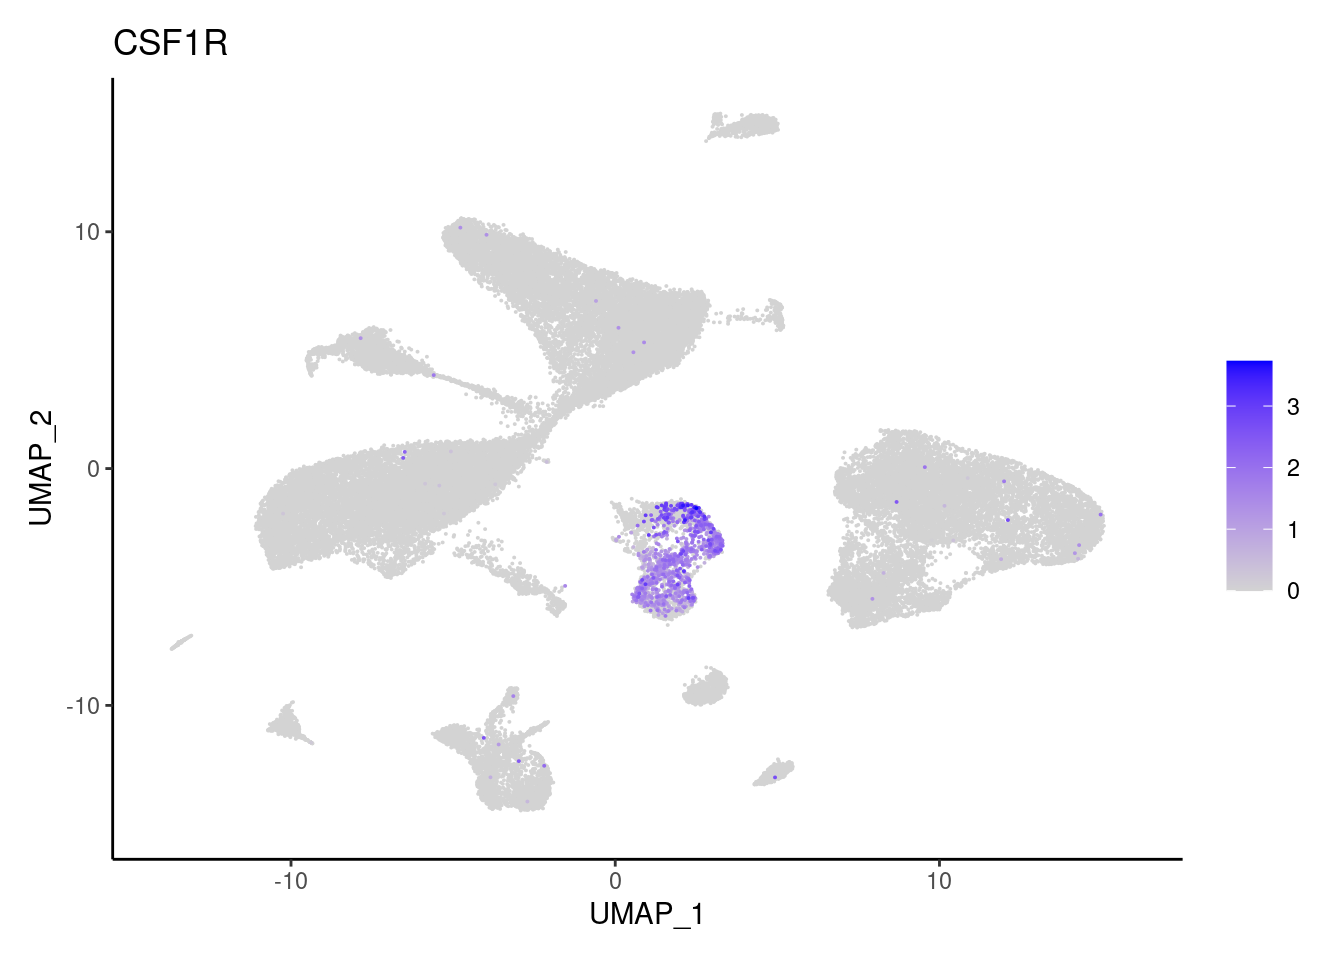
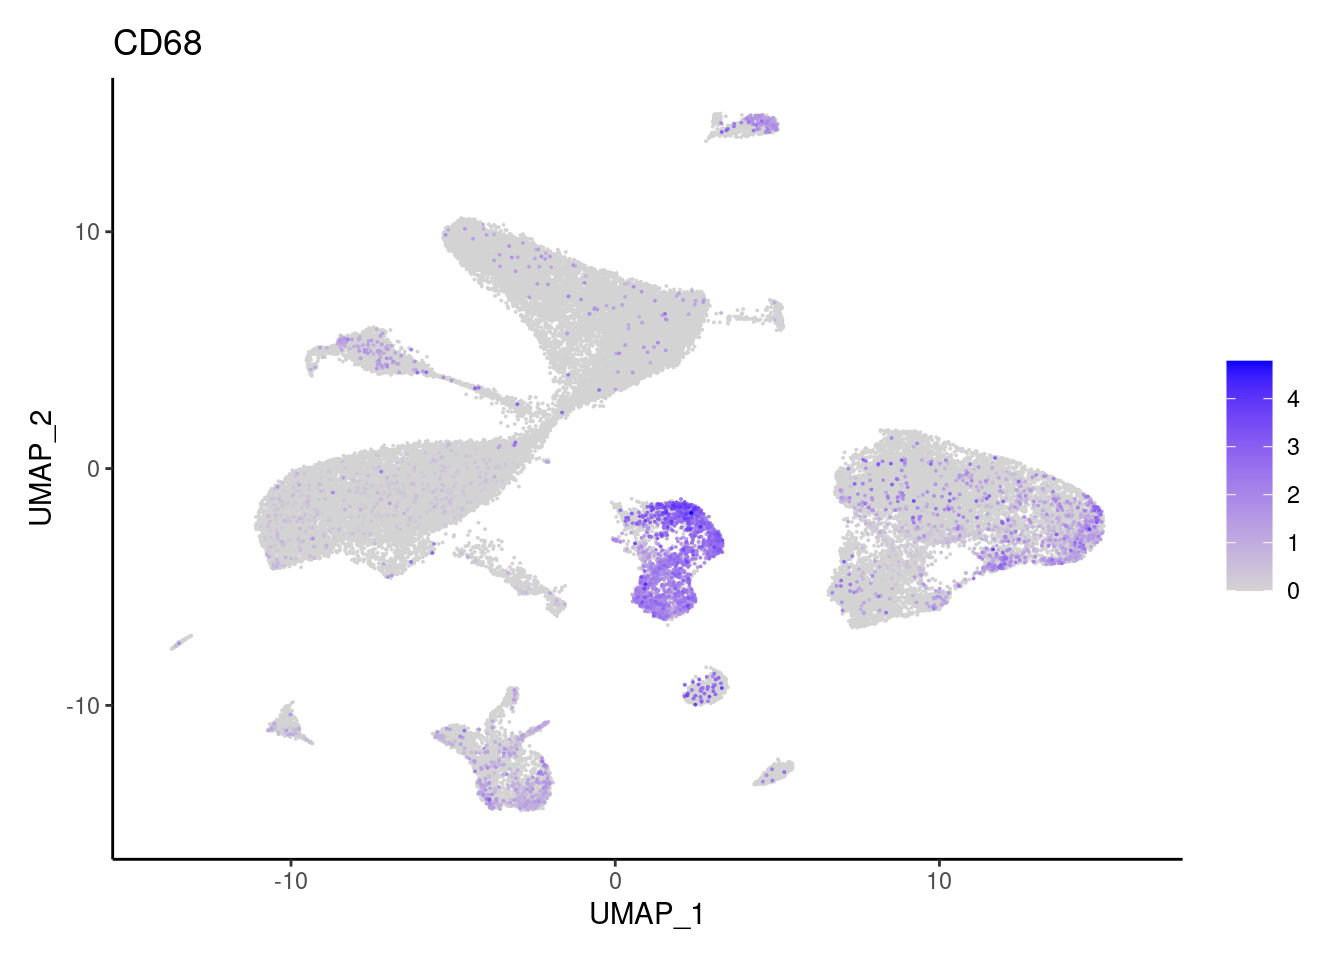
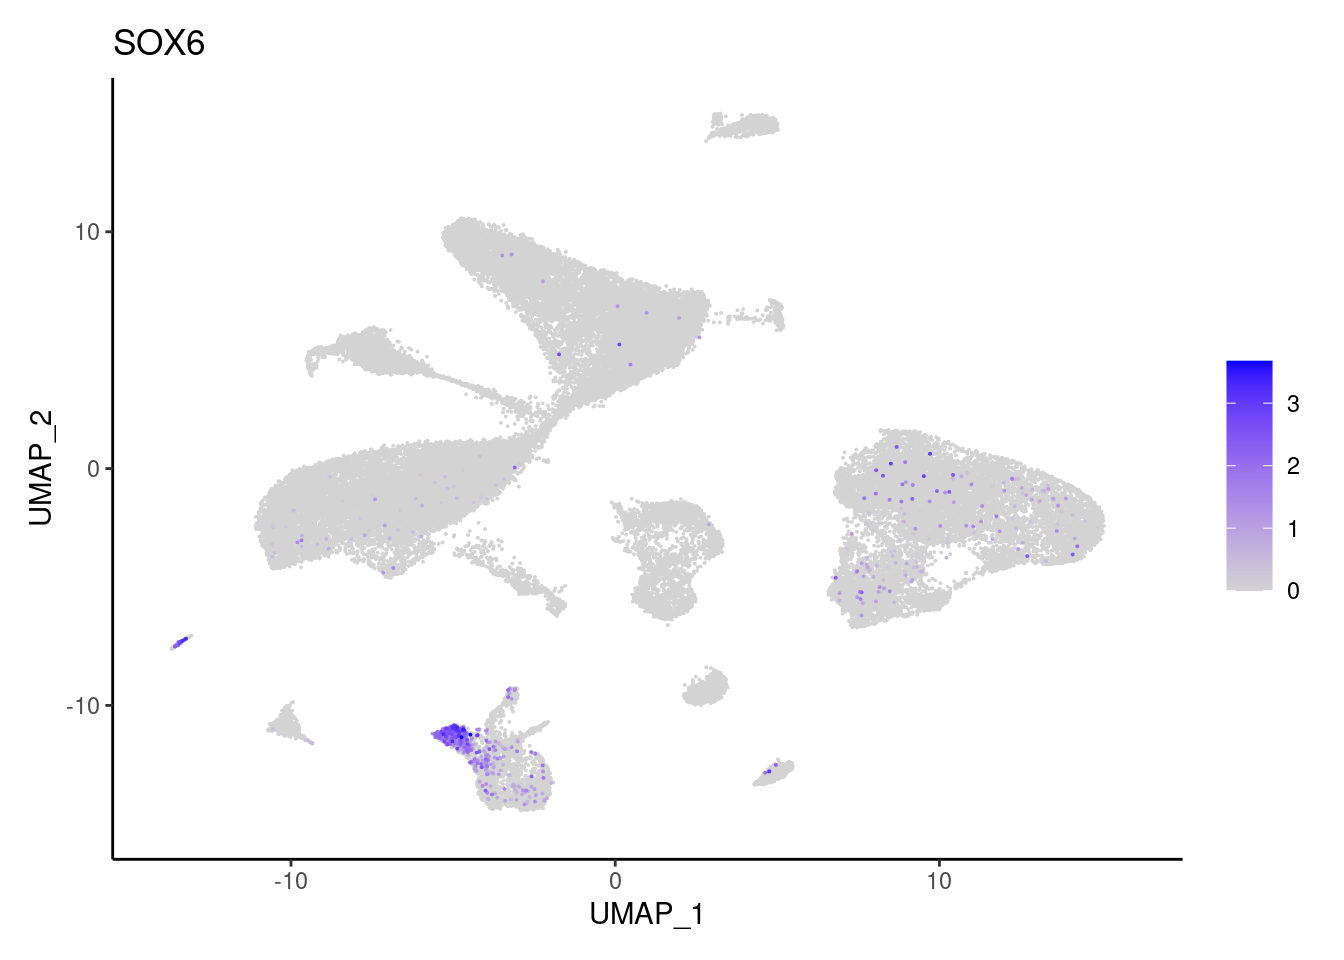
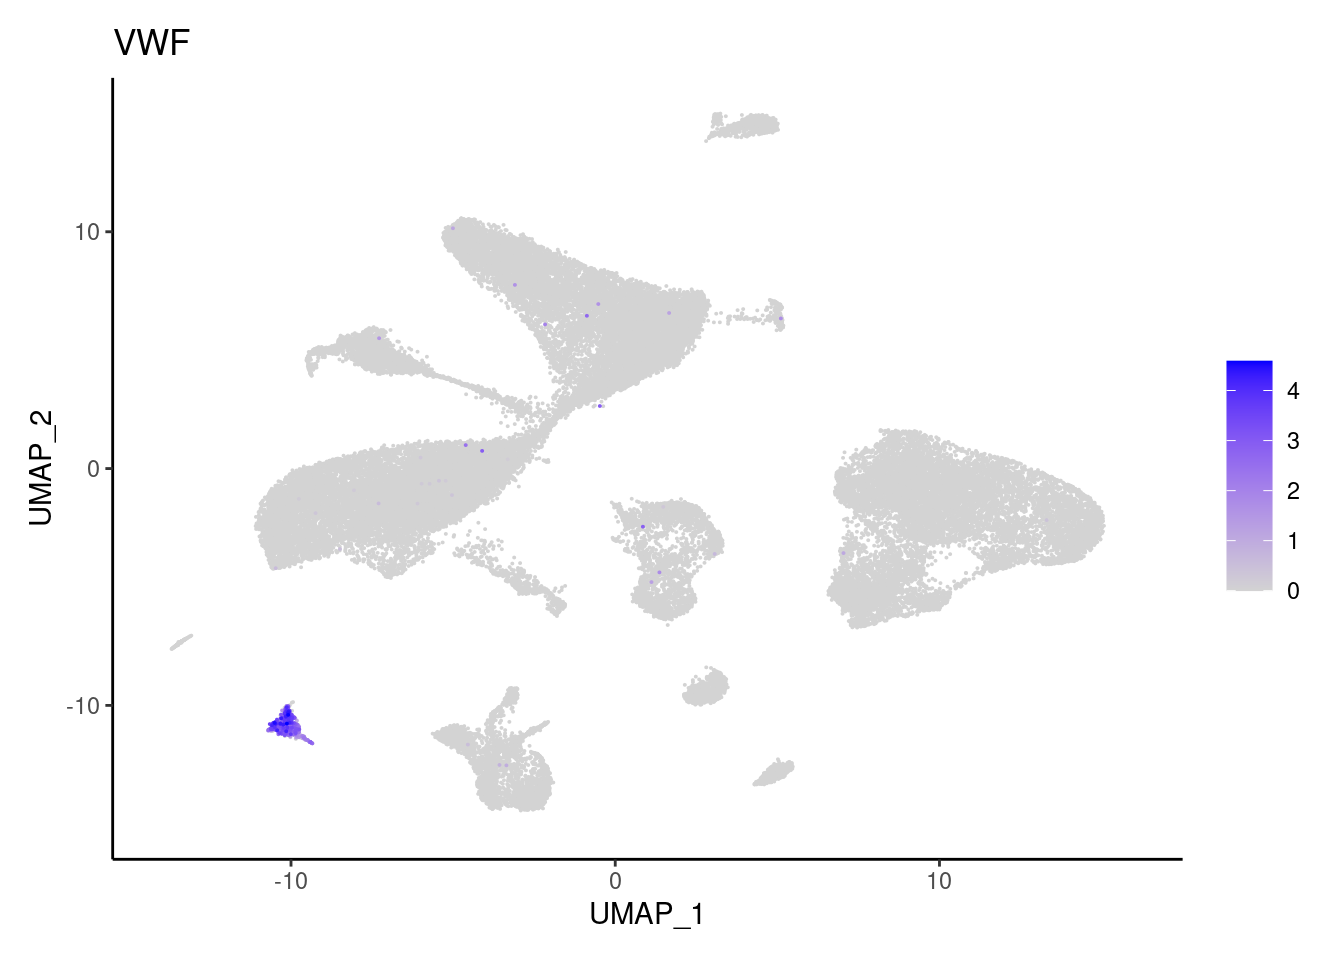
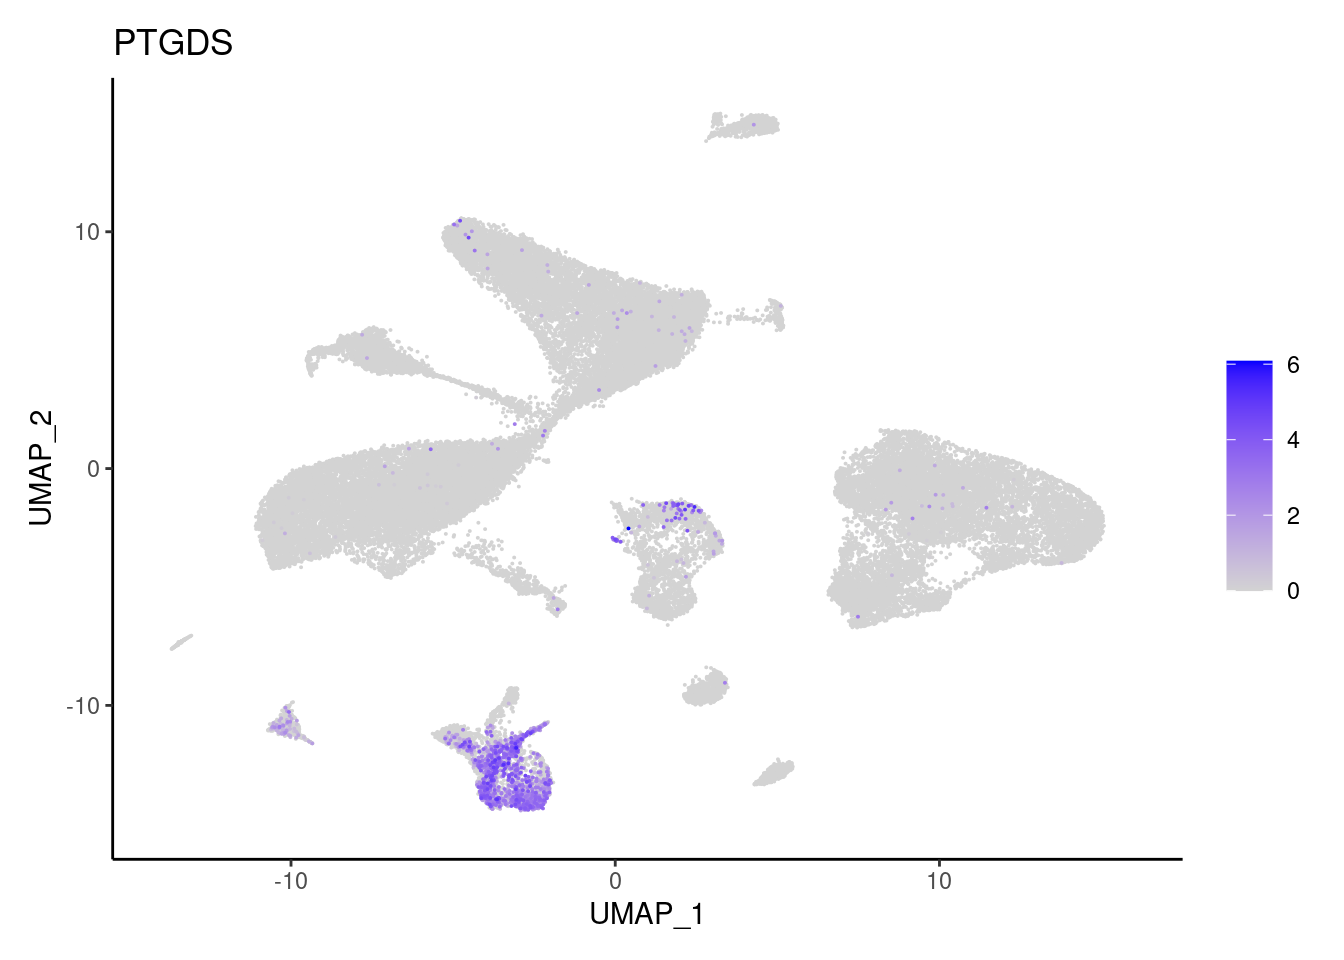
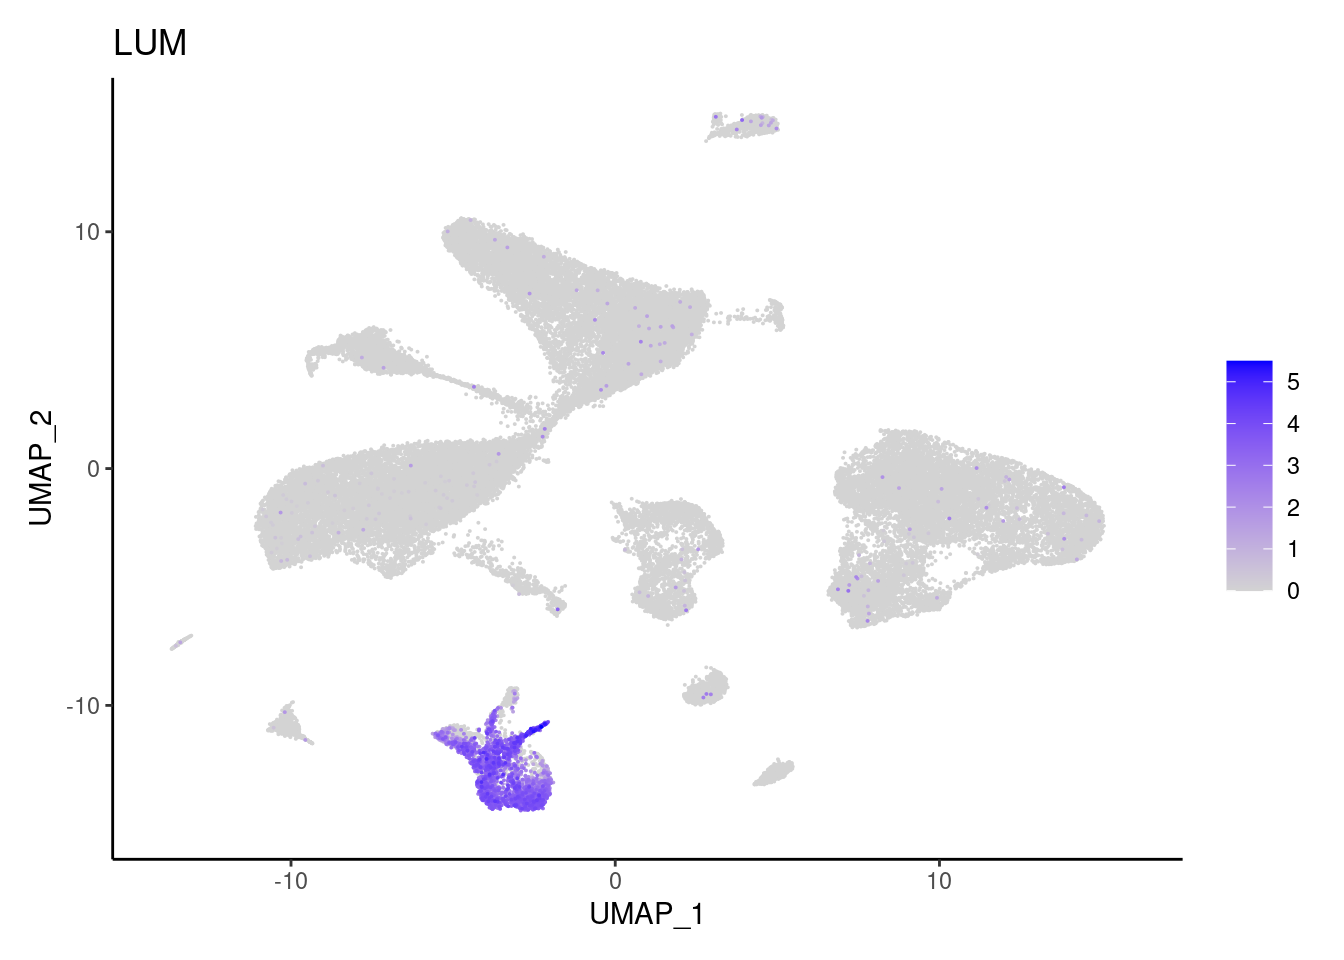
for(subset in unique(subset_genes$subset)){
cat("### ", subset, "{.tabset} \n\n")
genes <- subset_genes$gene[subset_genes$subset == subset]
for (gene in genes) {
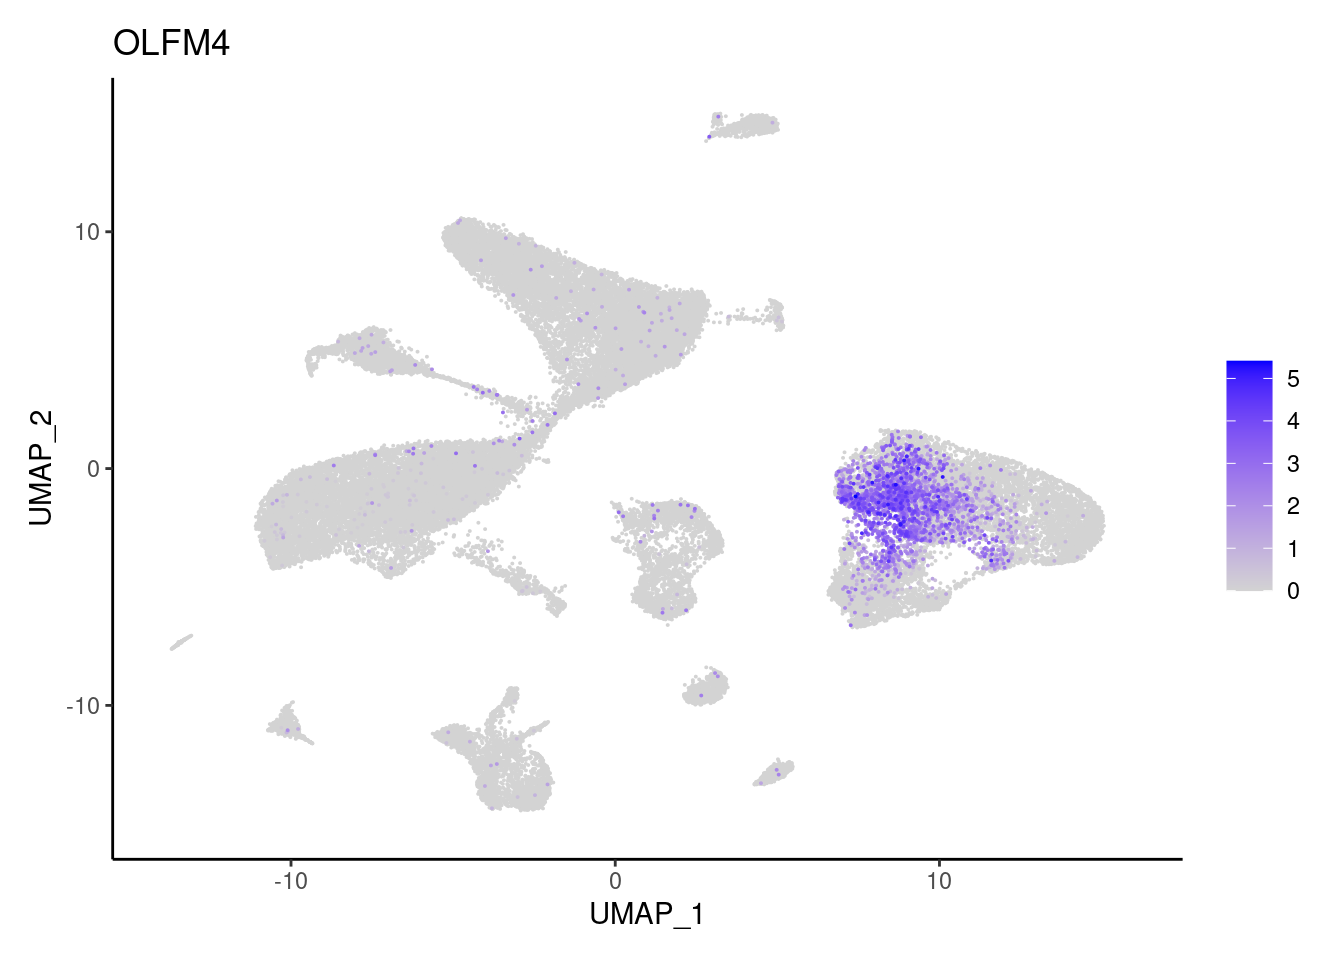
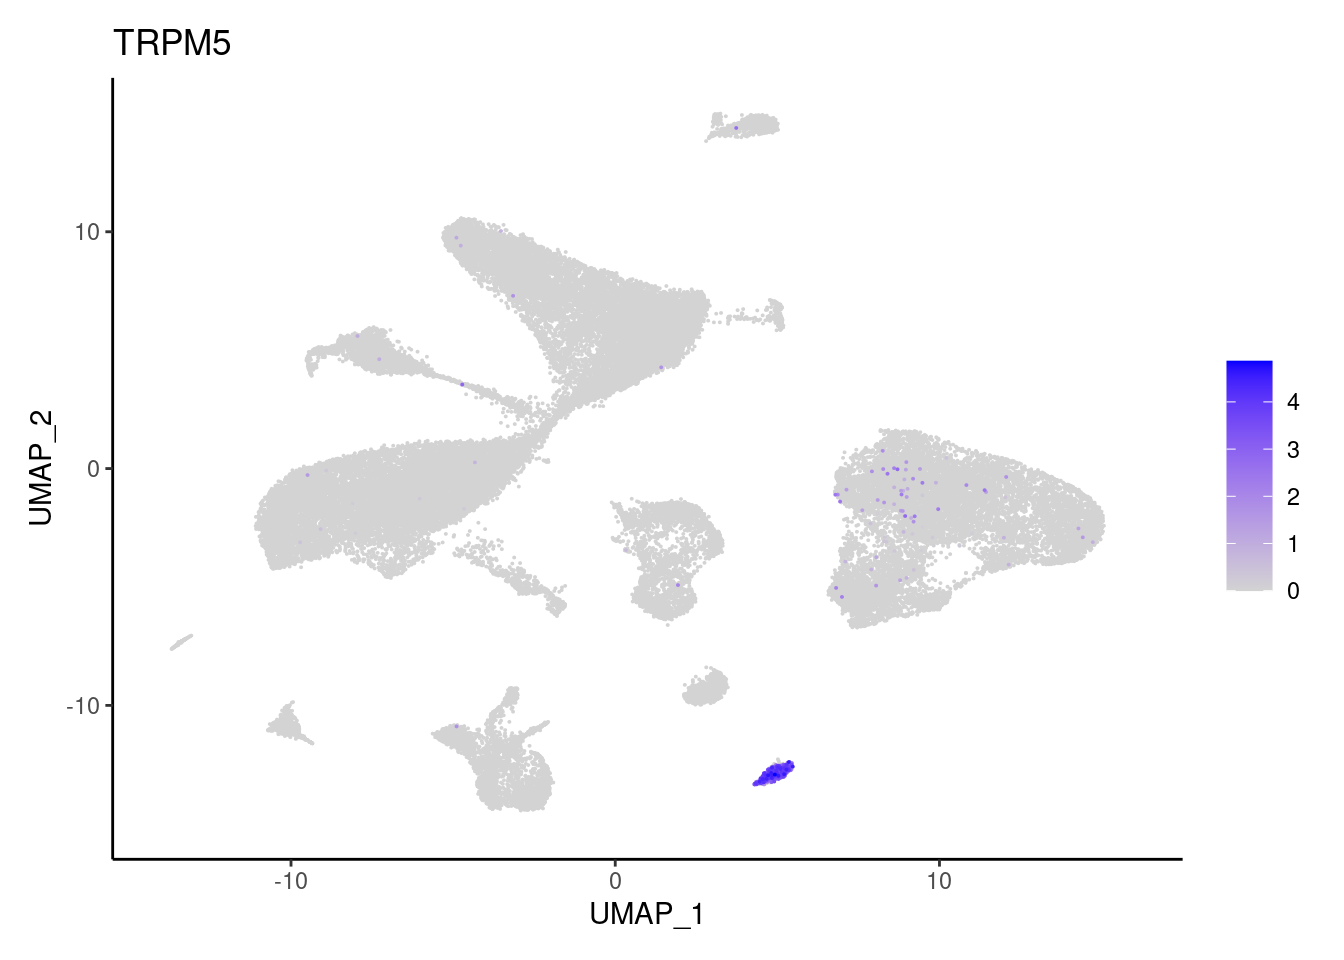
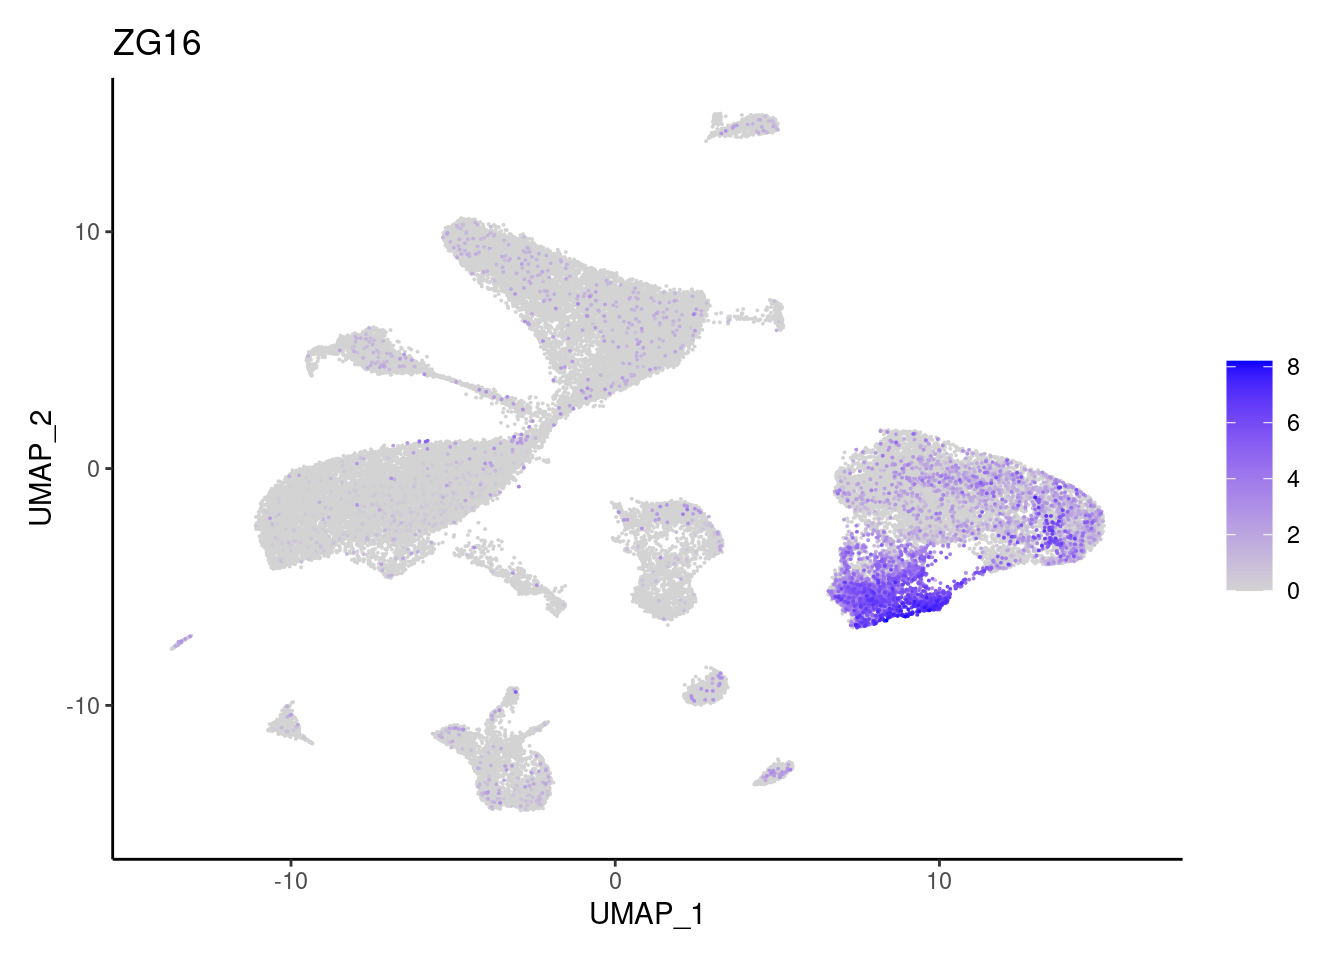
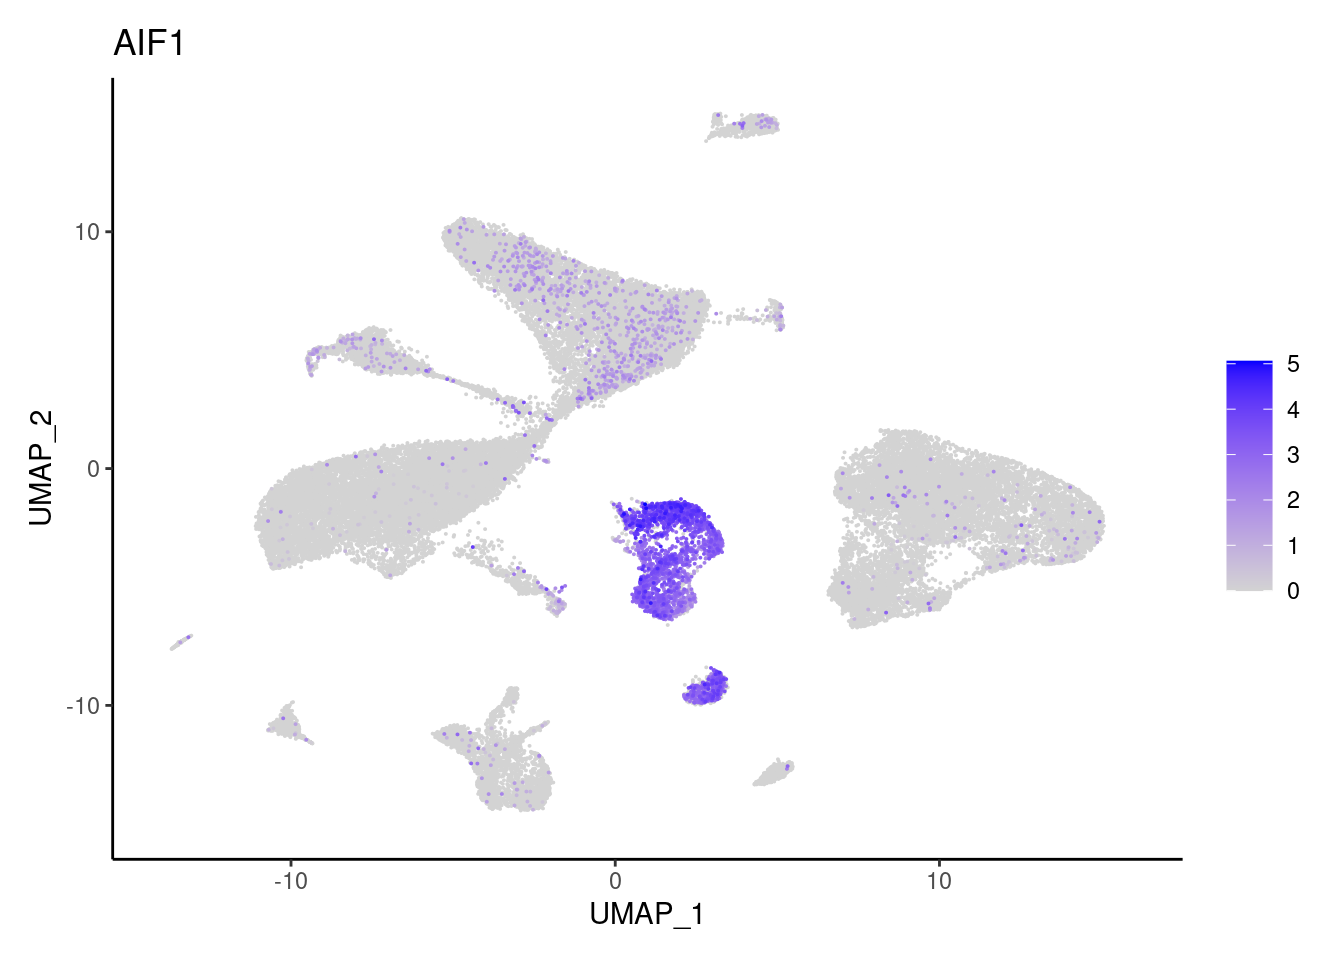
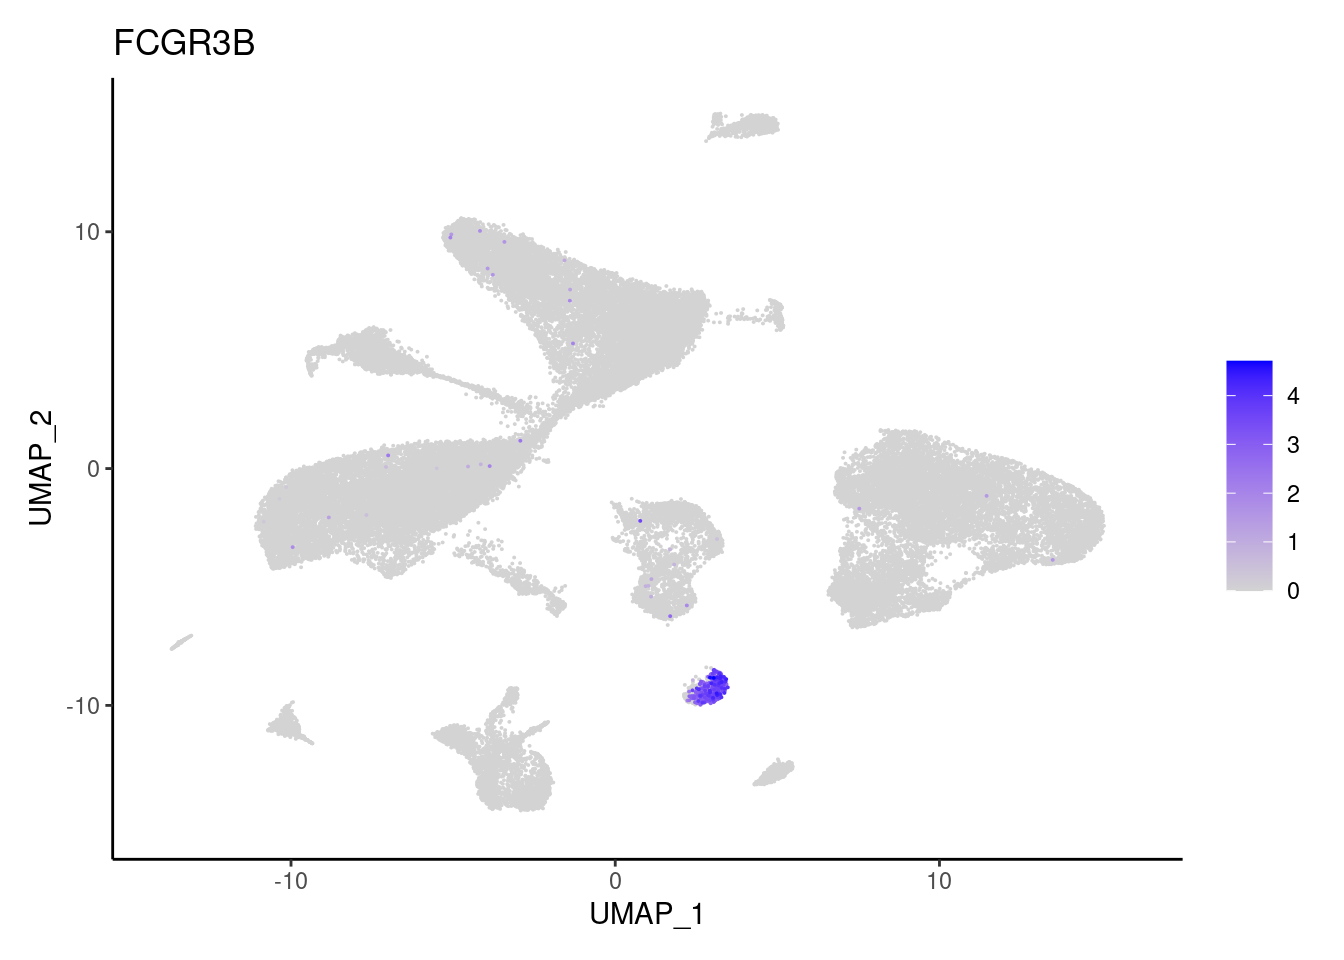
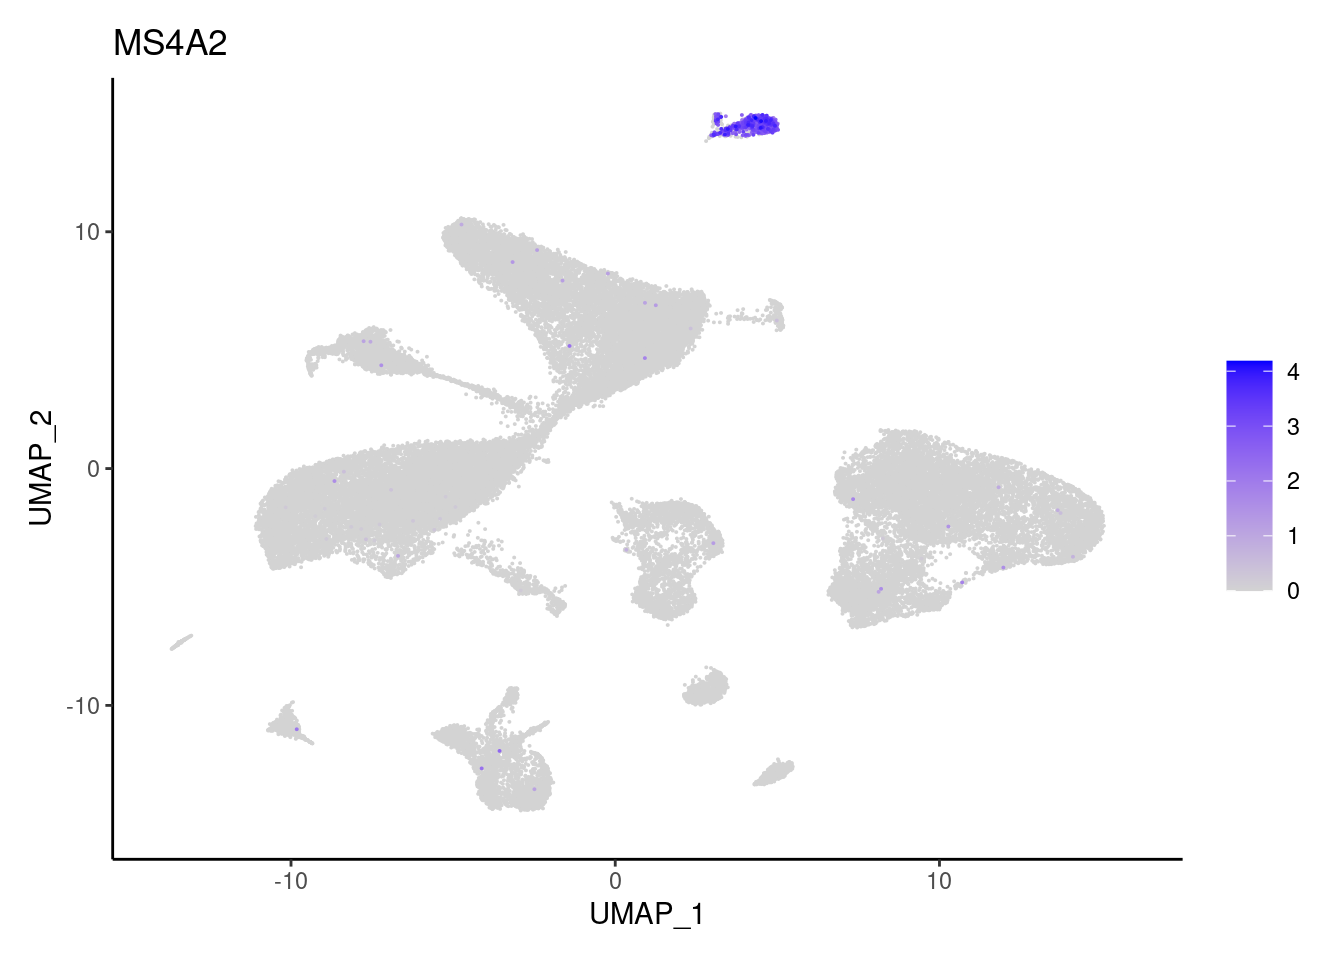
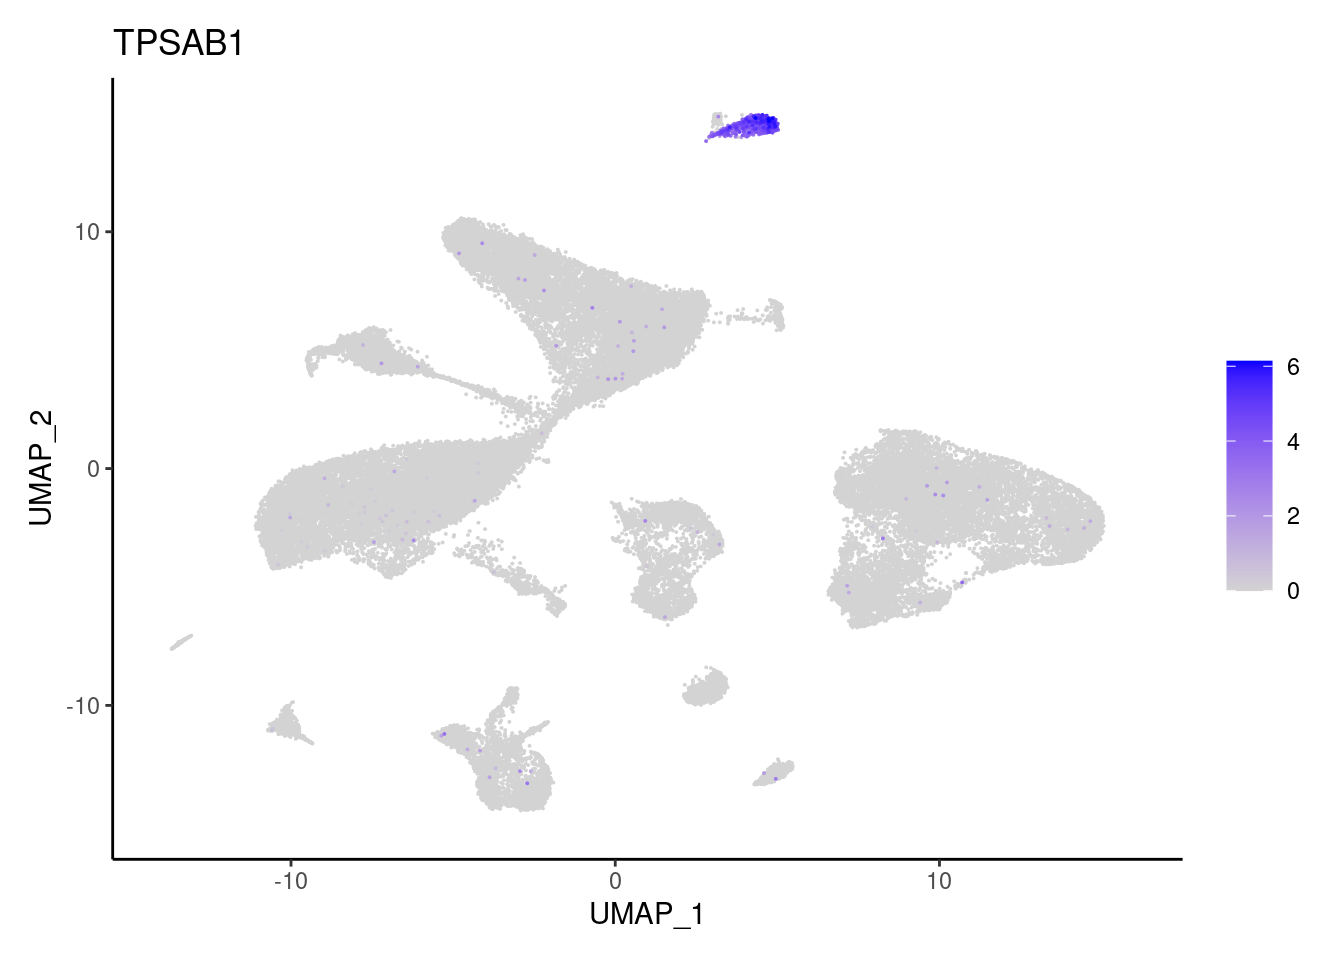
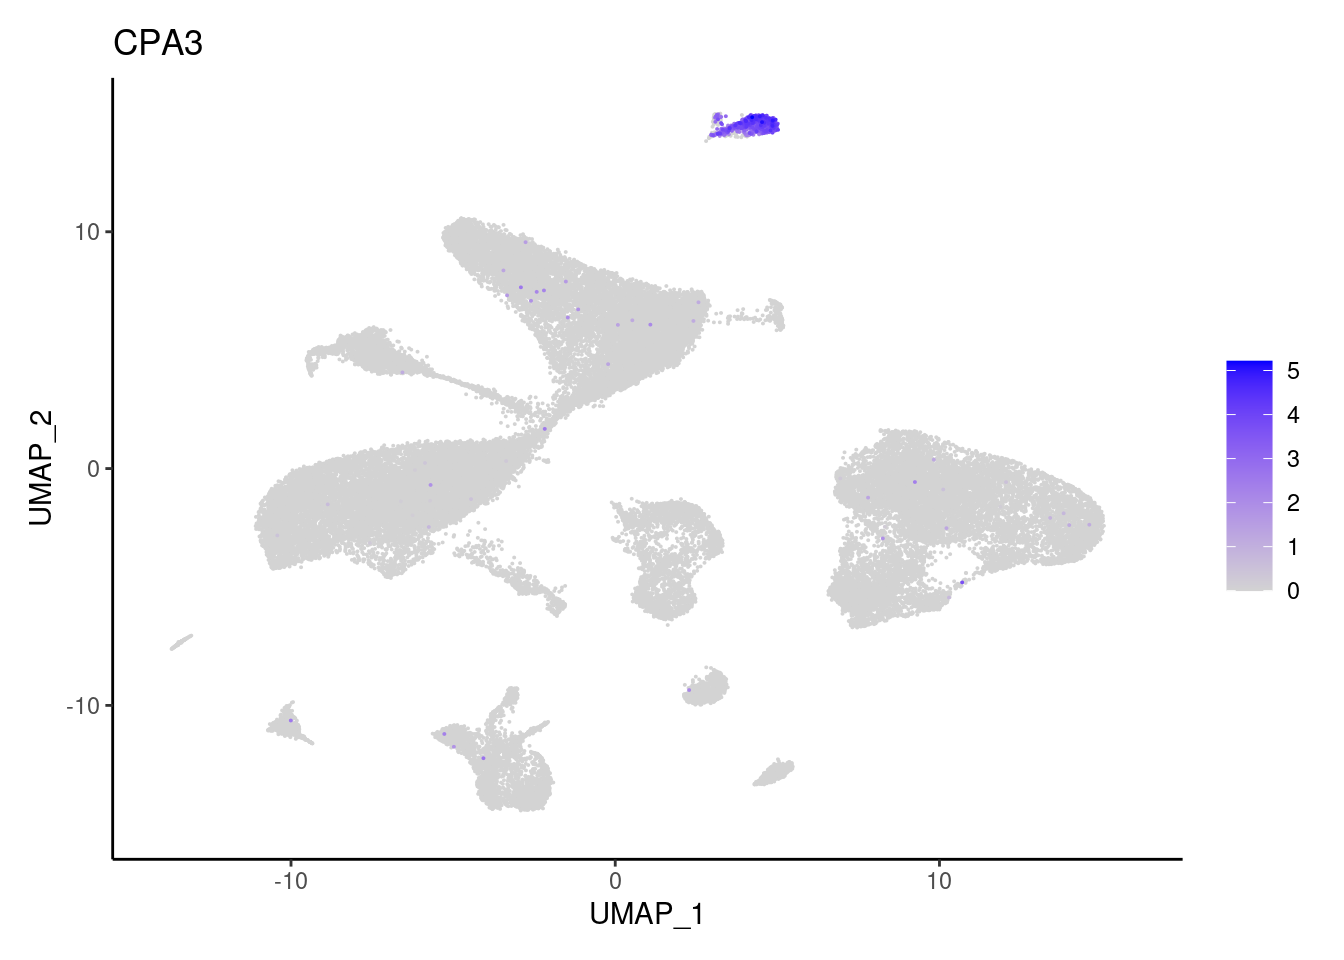
j <- FeaturePlot(seudataf, features = gene, order=T) + theme_classic()
cat("#### ", gene, "\n"); print(j); cat("\n\n")
}
}B and plasmacells
BANK1

CD19
CD79A
DERL3
MS4A1
MZB1
Epithelium
AQP8
BEST4
EPCAM
MUC2
OLFM4
TRPM5
ZG16
Myeloid cells
AIF1
C1QA

C1QB

CD14

CMTM2

FCGR3B
LYZ

MS4A2
TPSAB1
TPSB2

CPA3
CD14
CD163
CSF1R
CD68
Stromal cells
ACTA2
ADAMDEC1
CHI3L1
COL3A1

NRXN1

PLVAP
SOX6
VWF
PDGFRA

PDGFRB

PTGDS
LUM
MMP2
T cells
CD3D

CD3E
CD3G

CD8A
FOXP3
GZMA
GZMB
TRAC

NKG7
TRBC1
NK or NKT cells
KLRB1

cat("## Dotplot \n")Dotplot
DotPlot(seudataf, features = unique(subset_genes$gene), group.by = 'RNA_snn_res.0.1' ) + theme_classic() + theme(axis.text.x = element_text(angle=90, vjust = 0.5), axis.title = element_blank()) + NoLegend() + labs(title = 'Resolution 0.1')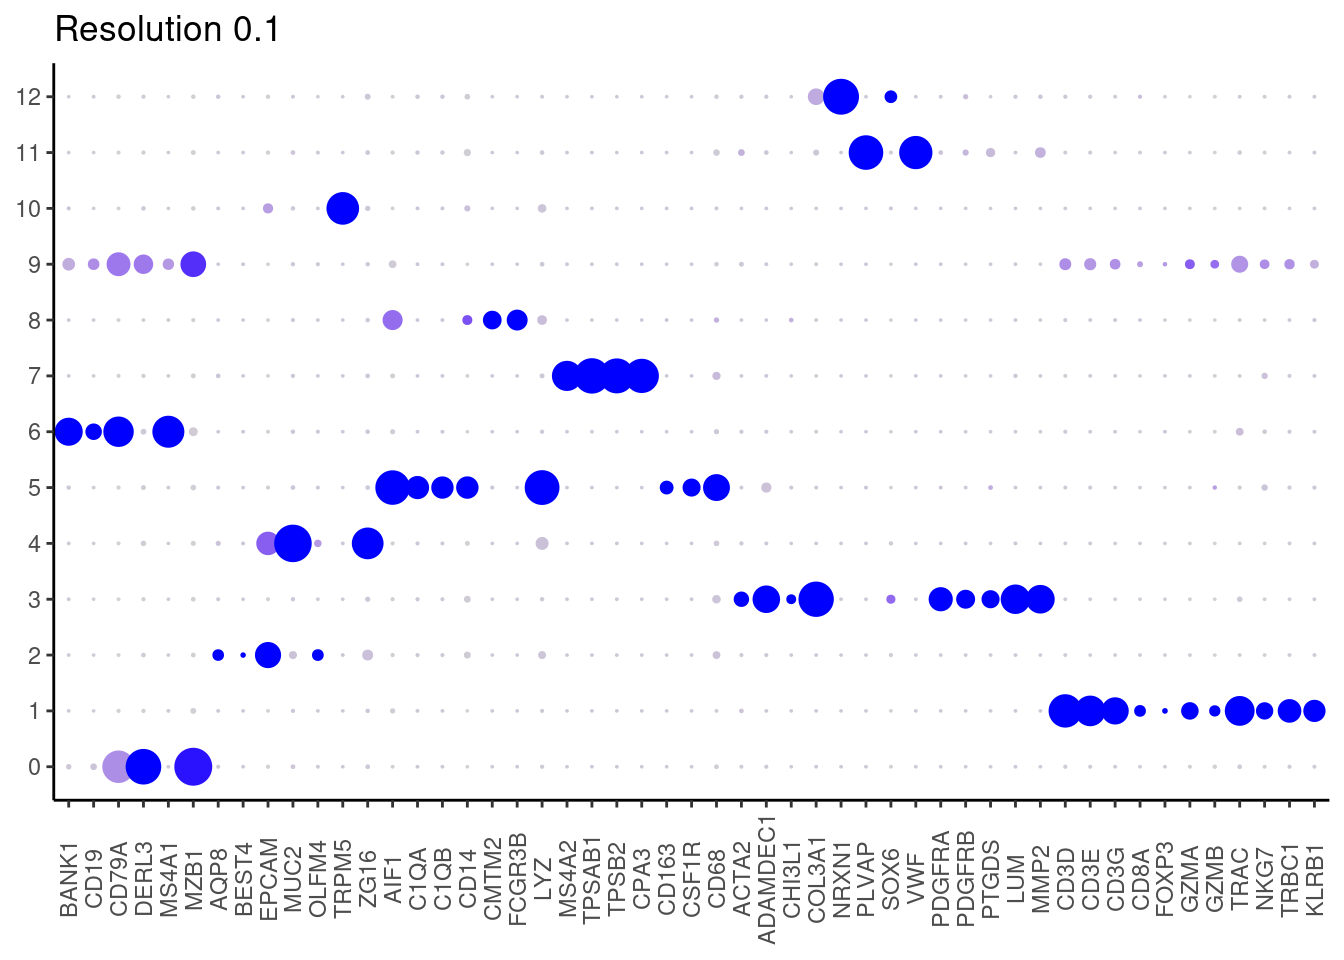
Subsets
We separate an extra subset of cycling cells and save each subset as a separated object.
myeloids <- seudataf[,seudataf$RNA_snn_res.0.1 %in% c(5,7,8)]
tcells <- seudataf[,seudataf$RNA_snn_res.0.1 %in% c(1)]
plasmas <- seudataf[,seudataf$RNA_snn_res.0.1 %in% c(0, 6)]
epi <- seudataf[,seudataf$RNA_snn_res.0.1 %in% c(2,4,10)]
stroma <- seudataf[,seudataf$RNA_snn_res.0.1 %in% c(12,11,3)]
cycling <- seudataf[,seudataf$RNA_snn_res.0.1 %in% c(9)]

dir.create('~/000_GitHub/ibd-bcn_single_cell/Analysis of our data/02_Samples_Together/SUBSETS/')
setwd('~/000_GitHub/ibd-bcn_single_cell/Analysis of our data/02_Samples_Together/SUBSETS/')
dir.create('FROM_SAMPLES_TOGETHER')

# save each subset as a separated object
saveRDS(myeloids,'FROM_SAMPLES_TOGETHER/myeloids.RDS')
saveRDS(tcells,'FROM_SAMPLES_TOGETHER/tcells.RDS')
saveRDS(plasmas,'FROM_SAMPLES_TOGETHER/plasmas.RDS')
saveRDS(epi,'FROM_SAMPLES_TOGETHER/epi.RDS')
saveRDS(stroma,'FROM_SAMPLES_TOGETHER/stroma.RDS')
saveRDS(cycling,'FROM_SAMPLES_TOGETHER/cycling.RDS')
sessionInfo()
sessionInfo()## R version 4.1.2 (2021-11-01)
## Platform: x86_64-pc-linux-gnu (64-bit)
## Running under: Ubuntu 20.04.5 LTS
##
## Matrix products: default
## BLAS: /usr/lib/x86_64-linux-gnu/blas/libblas.so.3.9.0
## LAPACK: /opt/R/4.1.2/lib/R/lib/libRlapack.so
##
## locale:
## [1] LC_CTYPE=C.UTF-8 LC_NUMERIC=C LC_TIME=C.UTF-8 LC_COLLATE=C.UTF-8
## [5] LC_MONETARY=C.UTF-8 LC_MESSAGES=C LC_PAPER=C.UTF-8 LC_NAME=C
## [9] LC_ADDRESS=C LC_TELEPHONE=C LC_MEASUREMENT=C.UTF-8 LC_IDENTIFICATION=C
##
## attached base packages:
## [1] stats4 stats graphics grDevices utils datasets methods base
##
## other attached packages:
## [1] Matrix_1.4-0 nnet_7.3-17 matchSCore2_0.1.0 harmony_0.1.0
## [5] Rcpp_1.0.9 rmarkdown_2.18 pandoc_0.1.0 readxl_1.3.1
## [9] magick_2.7.3 data.table_1.14.2 BiocParallel_1.28.3 RColorBrewer_1.1-3
## [13] ggrepel_0.9.1 ggrastr_1.0.1 usethis_2.1.5 clustree_0.4.4
## [17] ggraph_2.0.5 readr_2.1.2 dplyr_1.0.10 cowplot_1.1.1
## [21] reshape_0.8.8 formulaic_0.0.8 patchwork_1.1.2 MASS_7.3-55
## [25] viridis_0.6.2 viridisLite_0.4.1 scDblFinder_1.8.0 scran_1.22.1
## [29] scater_1.22.0 scuttle_1.4.0 celda_1.10.0 beepr_1.3
## [33] DropletUtils_1.14.2 SingleCellExperiment_1.16.0 SummarizedExperiment_1.24.0 Biobase_2.54.0
## [37] GenomicRanges_1.46.1 GenomeInfoDb_1.30.1 IRanges_2.28.0 S4Vectors_0.32.4
## [41] BiocGenerics_0.40.0 MatrixGenerics_1.6.0 matrixStats_0.62.0 ggplot2_3.3.6
## [45] plyr_1.8.7 sp_1.5-0 SeuratObject_4.1.1 Seurat_4.1.0.9007
##
## loaded via a namespace (and not attached):
## [1] rsvd_1.0.5 ica_1.0-3 corpcor_1.6.10 assertive.properties_0.0-4
## [5] foreach_1.5.2 lmtest_0.9-40 rprojroot_2.0.3 crayon_1.5.2
## [9] spatstat.core_2.4-4 rhdf5filters_1.6.0 backports_1.4.1 nlme_3.1-155
## [13] rlang_1.0.6 XVector_0.34.0 ROCR_1.0-11 irlba_2.3.5
## [17] SparseM_1.81 limma_3.50.3 xgboost_1.5.0.2 rjson_0.2.21
## [21] bit64_4.0.5 glue_1.6.2 sctransform_0.3.4 parallel_4.1.2
## [25] vipor_0.4.5 spatstat.sparse_2.1-1 AnnotationDbi_1.56.2 spatstat.geom_2.4-0
## [29] tidyselect_1.1.2 fitdistrplus_1.1-8 tidyr_1.2.1 assertive.types_0.0-3
## [33] zoo_1.8-10 org.Mm.eg.db_3.14.0 xtable_1.8-4 magrittr_2.0.3
## [37] evaluate_0.18 cli_3.4.0 zlibbioc_1.40.0 rstudioapi_0.13
## [41] miniUI_0.1.1.1 bslib_0.4.1 rpart_4.1.16 RcppEigen_0.3.3.9.2
## [45] shiny_1.7.3 BiocSingular_1.10.0 xfun_0.34 clue_0.3-60
## [49] cluster_2.1.2 tidygraph_1.2.1 KEGGREST_1.34.0 tibble_3.1.8
## [53] listenv_0.8.0 Biostrings_2.62.0 png_0.1-7 future_1.28.0
## [57] withr_2.5.0 bitops_1.0-7 ggforce_0.3.3 cellranger_1.1.0
## [61] assertive.base_0.0-9 dqrng_0.3.0 pillar_1.8.1 GlobalOptions_0.1.2
## [65] cachem_1.0.6 fs_1.5.2 GetoptLong_1.0.5 DelayedMatrixStats_1.16.0
## [69] vctrs_0.4.1 ellipsis_0.3.2 generics_0.1.3 tools_4.1.2
## [73] beeswarm_0.4.0 munsell_0.5.0 tweenr_1.0.2 DelayedArray_0.20.0
## [77] fastmap_1.1.0 compiler_4.1.2 pkgload_1.2.4 abind_1.4-5
## [81] httpuv_1.6.6 plotly_4.10.0 rgeos_0.5-9 GenomeInfoDbData_1.2.7
## [85] gridExtra_2.3 enrichR_3.0 edgeR_3.36.0 lattice_0.20-45
## [89] deldir_1.0-6 utf8_1.2.2 later_1.3.0 jsonlite_1.8.3
## [93] multipanelfigure_2.1.2 scales_1.2.1 graph_1.72.0 ScaledMatrix_1.2.0
## [97] pbapply_1.5-0 sparseMatrixStats_1.6.0 lazyeval_0.2.2 promises_1.2.0.1
## [101] doParallel_1.0.17 R.utils_2.12.0 goftest_1.2-3 checkmate_2.0.0
## [105] spatstat.utils_2.3-1 reticulate_1.26 textshaping_0.3.6 statmod_1.4.36
## [109] Rtsne_0.16 uwot_0.1.14 igraph_1.3.4 HDF5Array_1.22.1
## [113] survival_3.2-13 rsconnect_0.8.25 yaml_2.3.6 systemfonts_1.0.4
## [117] htmltools_0.5.3 memoise_2.0.1 locfit_1.5-9.6 graphlayouts_0.8.0
## [121] digest_0.6.30 assertthat_0.2.1 rappdirs_0.3.3 mime_0.12
## [125] RSQLite_2.2.17 future.apply_1.9.1 blob_1.2.3 R.oo_1.25.0
## [129] ragg_1.2.1 splines_4.1.2 labeling_0.4.2 Rhdf5lib_1.16.0
## [133] RCurl_1.98-1.8 assertive.numbers_0.0-2 hms_1.1.1 rhdf5_2.38.1
## [137] colorspace_2.0-3 ggbeeswarm_0.6.0 shape_1.4.6 assertive.files_0.0-2
## [141] sass_0.4.2 RANN_2.6.1 circlize_0.4.14 audio_0.1-10
## [145] fansi_1.0.3 tzdb_0.2.0 brio_1.1.3 parallelly_1.32.1
## [149] R6_2.5.1 grid_4.1.2 ggridges_0.5.3 lifecycle_1.0.3
## [153] formatR_1.12 bluster_1.4.0 curl_4.3.2 jquerylib_0.1.4
## [157] leiden_0.4.3 testthat_3.1.2 desc_1.4.0 RcppAnnoy_0.0.19
## [161] org.Hs.eg.db_3.14.0 iterators_1.0.14 stringr_1.4.1 topGO_2.46.0
## [165] htmlwidgets_1.5.4 beachmat_2.10.0 polyclip_1.10-0 purrr_0.3.4
## [169] gridGraphics_0.5-1 ComplexHeatmap_2.10.0 mgcv_1.8-38 globals_0.16.1
## [173] spatstat.random_2.2-0 progressr_0.11.0 codetools_0.2-18 GO.db_3.14.0
## [177] metapod_1.2.0 MCMCprecision_0.4.0 R.methodsS3_1.8.2 gtable_0.3.1
## [181] DBI_1.1.3 highr_0.9 tensor_1.5 httr_1.4.4
## [185] KernSmooth_2.23-20 vroom_1.5.7 stringi_1.7.8 reshape2_1.4.4
## [189] farver_2.1.1 combinat_0.0-8 BiocNeighbors_1.12.0 scattermore_0.8
## [193] bit_4.0.4 spatstat.data_2.2-0 pkgconfig_2.0.3 corrplot_0.92
## [197] knitr_1.40